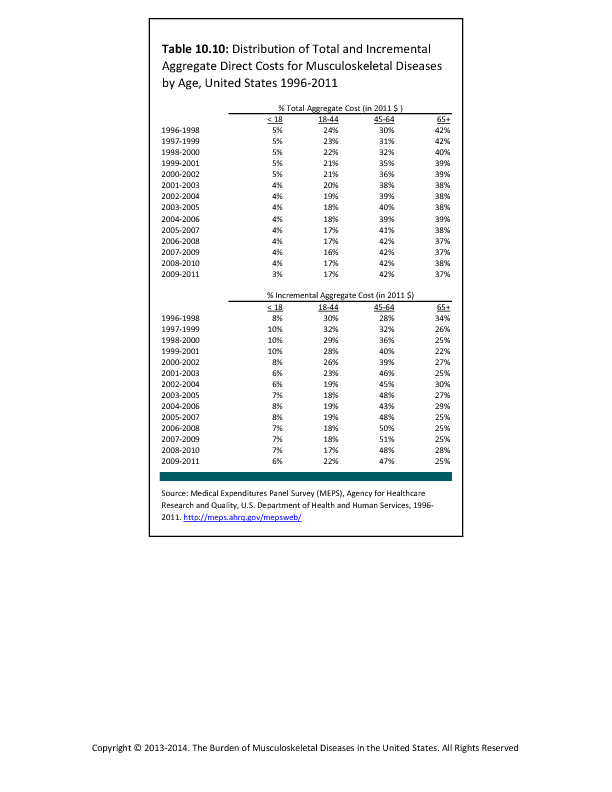
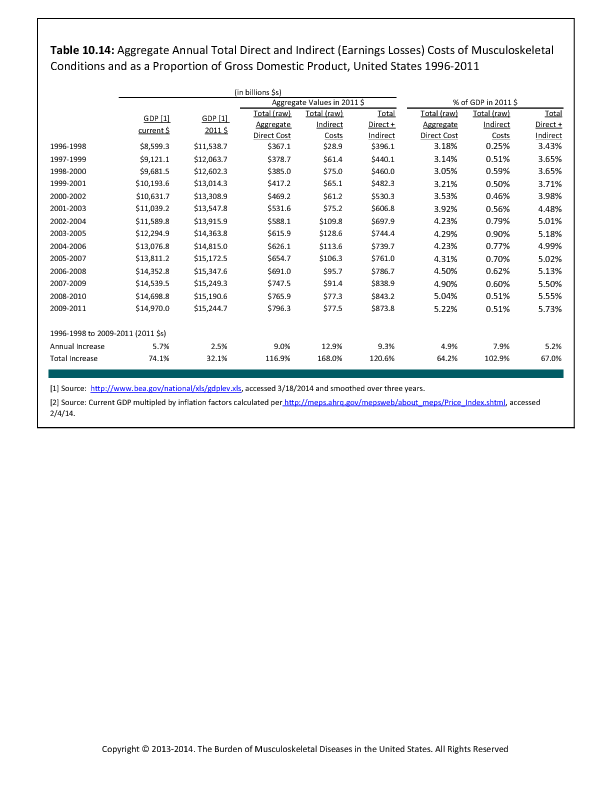
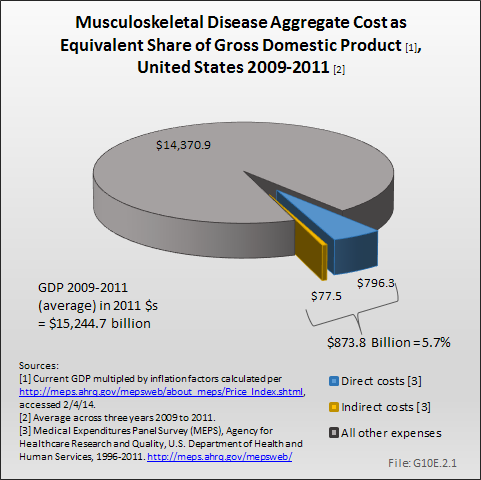
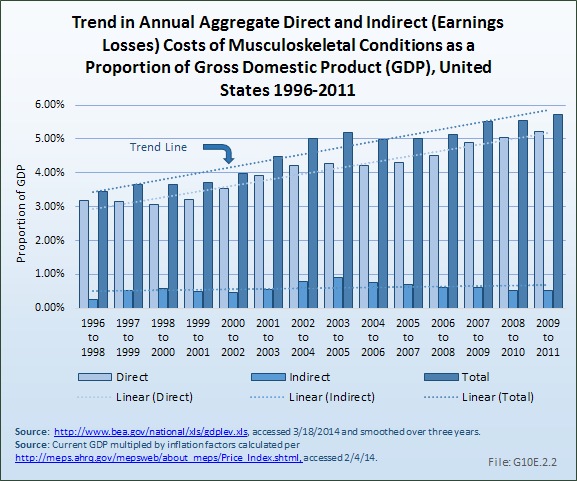
In the studies conducted by Rice and colleagues starting in the early 1960s, indirect cost associated with earnings losses due to musculoskeletal diseases constituted between 38% and 59% of the total cost of these diseases.1,2,3,4,5 The percentage shifted because in various eras, medical costs were rapidly escalating while earnings stagnated (1970s) and in other times wage growth exceeded the increase in medical costs (1960s and late 1990s). Analysis of the Medical Expenditures Panel Survey to estimate direct and indirect cost (ie, the cost of lost wages due to musculoskeletal conditions for persons age 18 to 64 years with a work history) as a proportion of GDP shows a slow but steady increase in the share of GDP accounted for by musculoskeletal conditions, from about 3.4% of GDP in 1996 to 1998 to about 5.7% in 2009 to -2011, an increase of 67%.6,7 (Reference Table 10.14 PDF CSV)
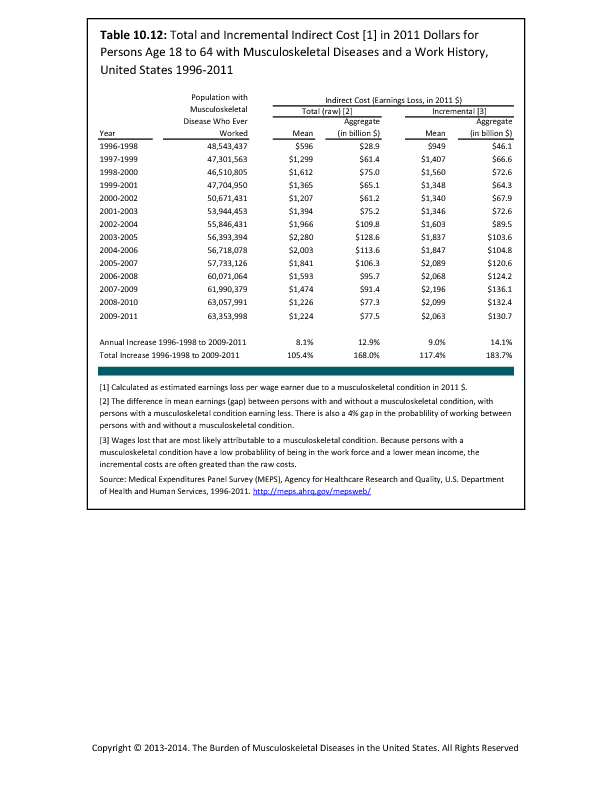
The method to estimate earnings losses is based on the notion that presence of musculoskeletal conditions is one among many factors affecting employment. Thus, estimates of total earnings losses, grew from 1996 to 1998 through the mid 2000s, then declined substantially with the recession because it became more difficult to differentiate the employment situation of persons with musculoskeletal conditions from that of similar individuals. However, when other characteristics of individuals were taken into account, the estimate of incremental earnings losses continued to trend upward, despite the recession. Overall, the average increment in earnings losses grew from $949 in 1996 to 1998 to $2,063 in 2009 to 2011, or by more than 100%. (Reference Table 10.12 PDF CSV)
Estimates of earnings losses are limited to persons age 18 to 64 years, both because the number of workers older than 65 years in MEPS is too small to permit statistically reliable estimates in this age group and because in the United States, most workers retire by that age. However, it is probable that some individuals with musculoskeletal diseases would continue working past the age of 65 years in the absence of the condition. Similarly, the tabulation of earnings losses is limited to those who have established a work history either prior to or after the onset of disease. There may be some among those without a work history who would have begun to work in the absence of a musculoskeletal disease, but who never had the opportunity to do so. Thus, the magnitude of earnings losses shown should be considered a conservative estimate.
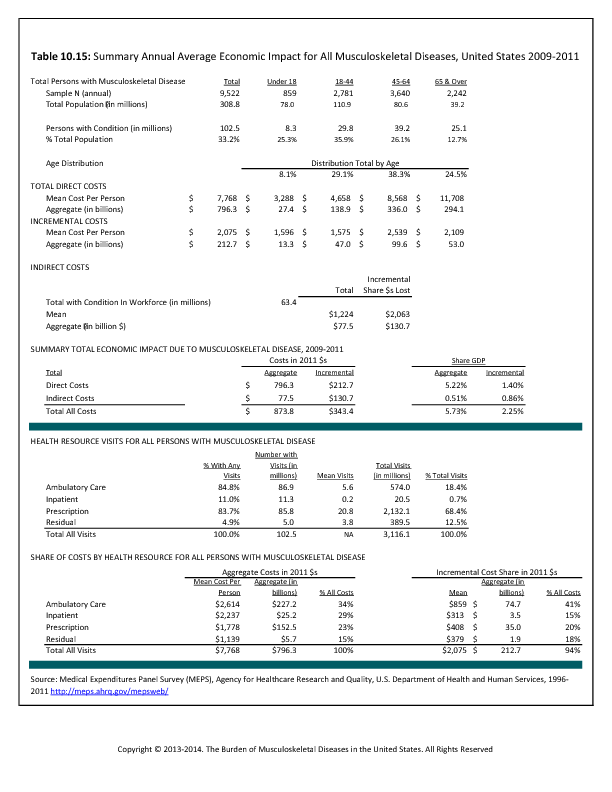
As of 1996 to 1998, about 48.5 million persons with a musculoskeletal disease had established a work history. On average, these individuals earned $596 in 2011 dollars less than those without musculoskeletal conditions; their earnings losses aggregated to $28.9 billion. By 2009 to 2011, the number of persons with musculoskeletal diseases and a work history had grown to over 63.3 million. On average, these workers had earnings losses of $1,224 each, or roughly a doubling. Aggregate total earnings losses grew to $77.5 billion, despite the decline associated with the recession.
Some of the estimated earnings losses of persons with musculoskeletal diseases might have occurred in the absence of these conditions because of other factors. For example, older workers and women, two groups with high rates of musculoskeletal diseases, have lower employment rates and earnings than the average US worker. The incremental earnings loss measure takes into consideration many of the factors that might cause persons to have lower earnings even without the presence of the musculoskeletal disease. Earnings losses using the incremental measure grew substantially between 1996 to 1998 and 2009 to 2011. In the earlier triad of years, the 48.5 million persons with musculoskeletal diseases and a work history sustained average incremental earnings losses of $949, or $46.1 billion overall, in 2011 dollars. Average incremental earnings losses more than doubled by 2009 to 2011, to $2,063; aggregate incremental earnings losses increased almost three-fold to $130.7 billion.
Using the more expansive definition of musculoskeletal diseases, average earnings losses rose from 1996 to 1998 through 1998 to 2000, but have been falling ever since; as of 2006 to 2008, earnings were actually greater among those included within the more expansive definition of musculoskeletal conditions than among the remainder of the working age population. In parallel, aggregate earnings losses have been falling since 1998 to 2000, turning negative in 2006 to 2008 and reaching -$158.6 billion in 2009 to 2011. (Note: Data on earnings losses of persons meeting the expansive definition of musculoskeletal diseases are not included in the tables.) Estimates of aggregate total earnings losses using the base case definition for this publication have declined from their peak in 2003 to 2005, but still are indicative of an adverse impact on earnings. It follows that the more expansive definition of conditions must necessarily include conditions which are not associated with work loss and resultant earnings losses.
- 1. Rice D: Estimating the Cost of Illness. Hyattsville, MD: National Center for Health Statistics, Health Economic Series, 1966, No. 6.
- 2. Cooper B, Rice D: The economic cost of illness revisited. Health Economics Series No. 6. Social Security Bulletin 1979;39:21-35.
- 3. Rice D, Hodgson T, Kopstein A: The economic costs of illness: A replication and update. Health Care Fin Rev 1985;7:61-80.
- 4. Rice D: Cost of musculoskeletal conditions, in Praemer A, Furner S, Rice D, eds: Musculoskeletal Conditions in the US. Rosemont, IL, American Academy of Orthopaedic Surgeons, 1992.
- 5. Rice D: Cost of musculoskeletal conditions, in Praemer A, Furner S, Rice D, eds: Musculoskeletal Conditions in the US, ed 2. Rosemont, IL, American Academy of Orthopaedic Surgeons, 1999.
- 6. The National Arthritis Data Task Force concluded that about half of the increase between the 1972 and 1980 studies by Rice and colleagues was due to improvements in the data sources available to Rice and colleagues, but the remainder represented a real increase.
- 7. Lawrence R, Helmick C, Arnett FC, et al: Estimates of the prevalence of arthritis and selected musculoskeletal disorders in the United States. Arthritis Rheum 1998;41:788-799.
Edition:
- 2014


 Download as CSV