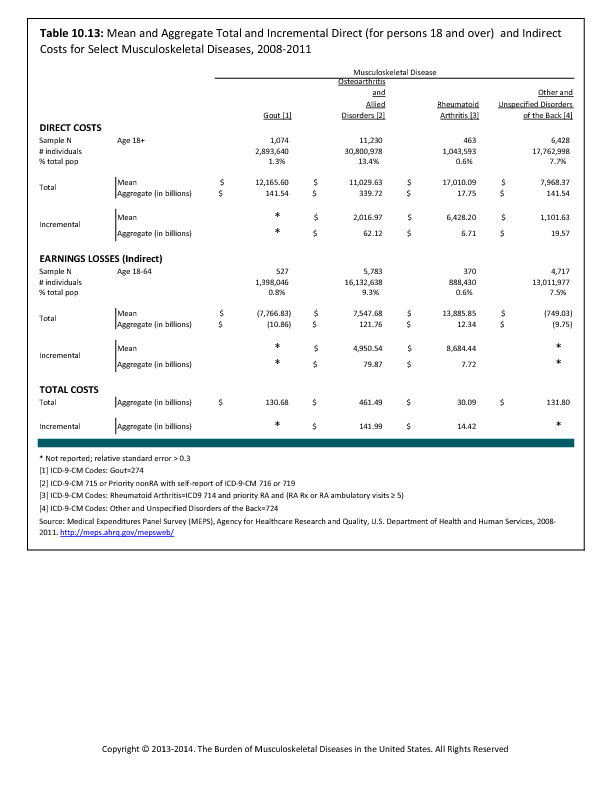
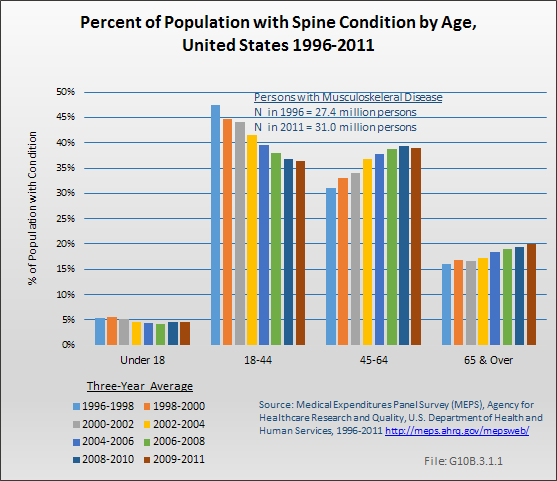
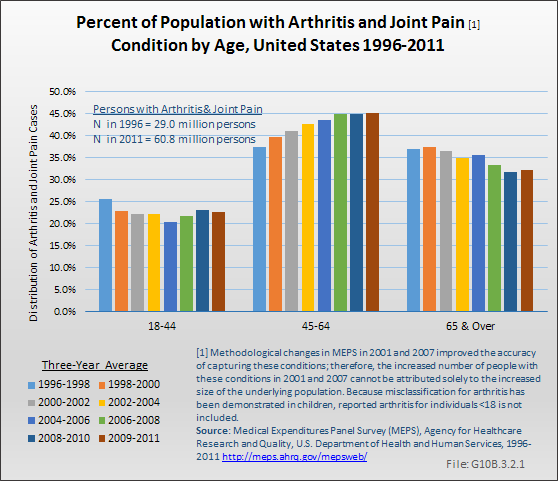
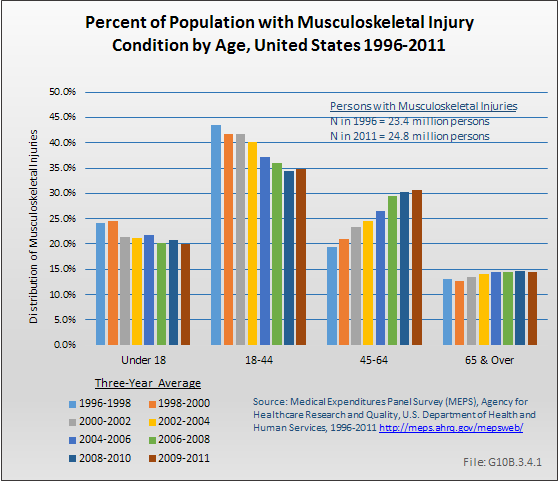
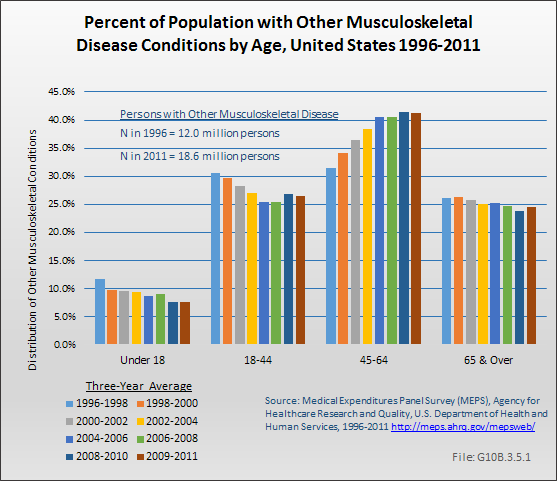
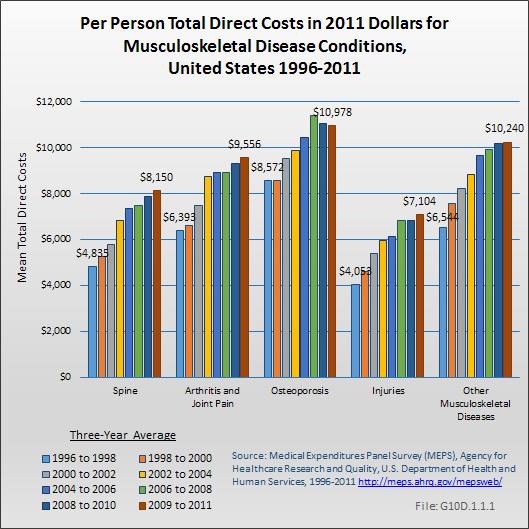
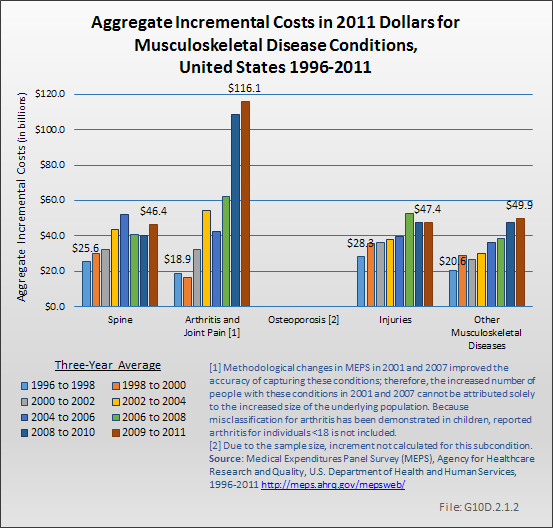
Because of the higher prevalence and relatively high level of expenditures per person, aggregate expenditures have consistently been greatest for arthritis and joint pain, accounting for $580.9 billion in health care costs in 2009 to 2011. Spine conditions, with an estimated $253.0 billion aggregate cost in 2009 to 2011, have held steady as the second most expensive musculoskeletal health care condition. Aggregate costs for injuries and other musculoskeletal conditions were $176.1 and $190.6, respectively, in 2009 to 2011. (Reference Table 10.6 PDF CSV)
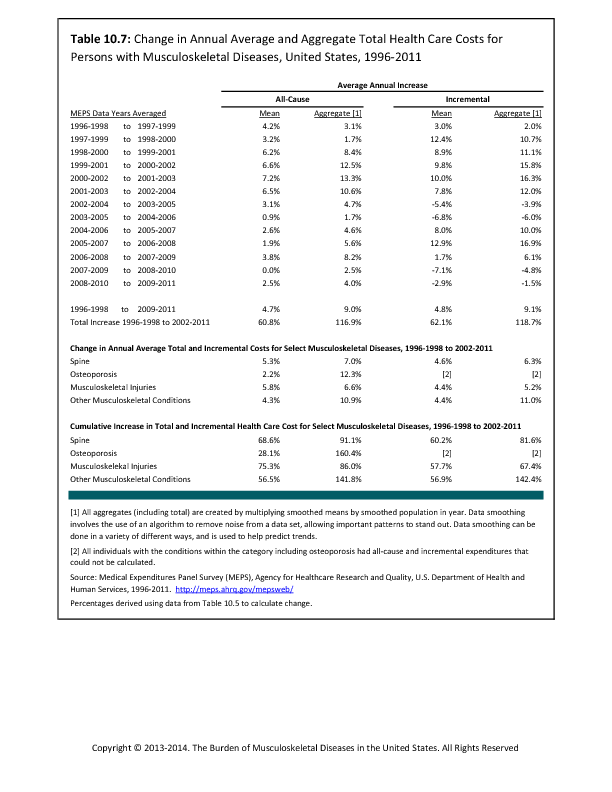
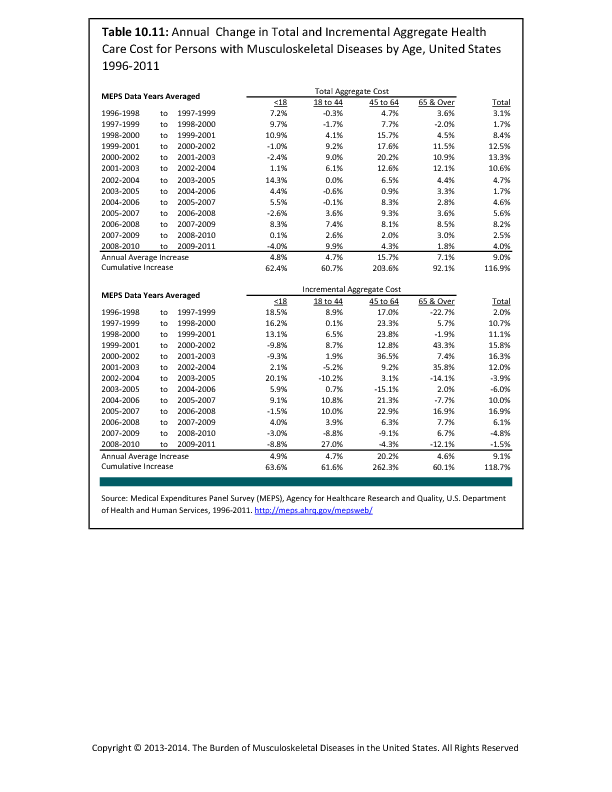
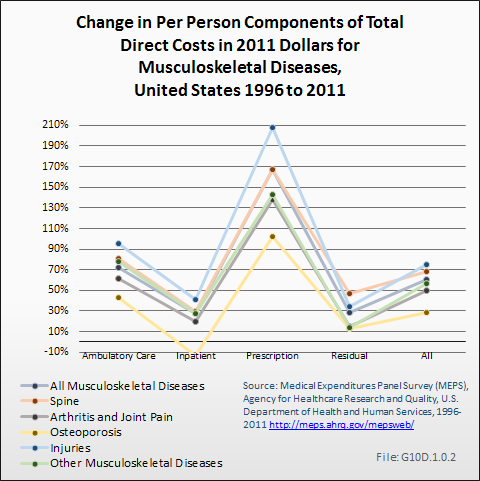
The magnitude of increase in aggregate total expenditures between 1996 to 1998 and 2009 to 2011 is greatest for the diseases within the category including osteoporosis (about 160%), but was substantial for all musculoskeletal diseases. The aggregate total cost of health care for spine conditions increased by more than 91%; musculoskeletal injuries by 86%; and other musculoskeletal diseases by about 142% over the period 1996 to 1991 through 2009 to 2001. (Reference Table 10.7 PDF CSV)
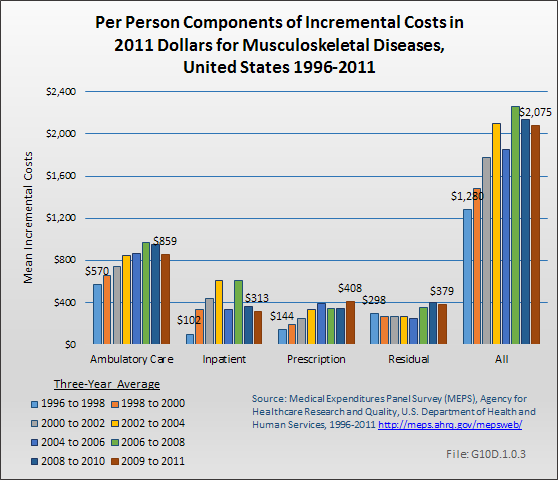
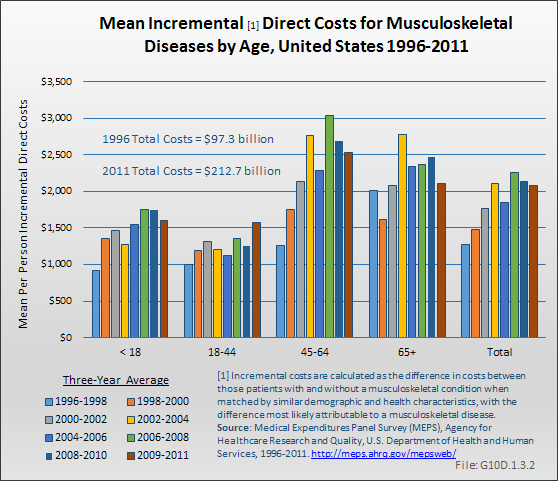
Sampling variability limits inference about time trends in incremental expenditures associated with the subcondition groups. However, while estimates do not have the same precision as those for all musculoskeletal diseases, it is fair to conclude that 2009 to 2011 aggregate incremental expenditures, at $116.1 billion, were largest for arthritis and joint pain. (Reference Table 10.6 PDF CSV)
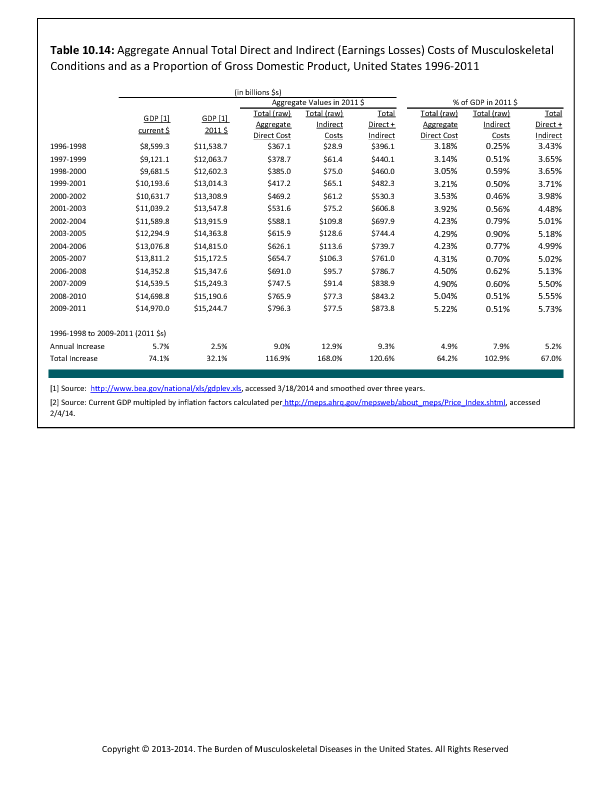
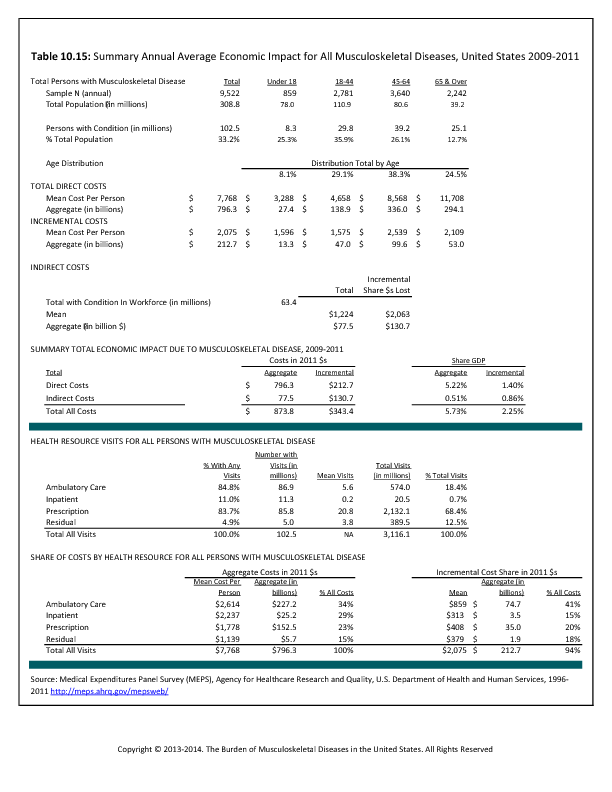
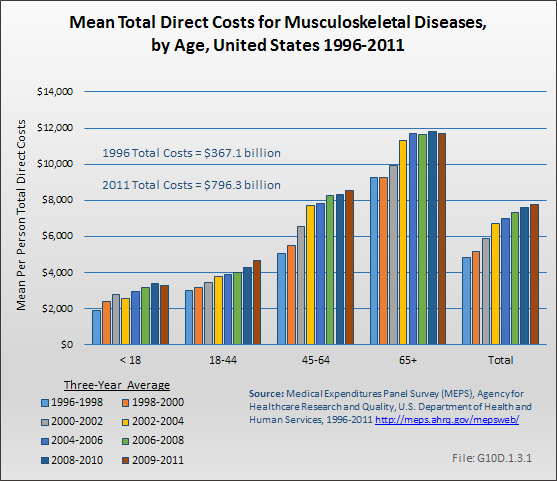
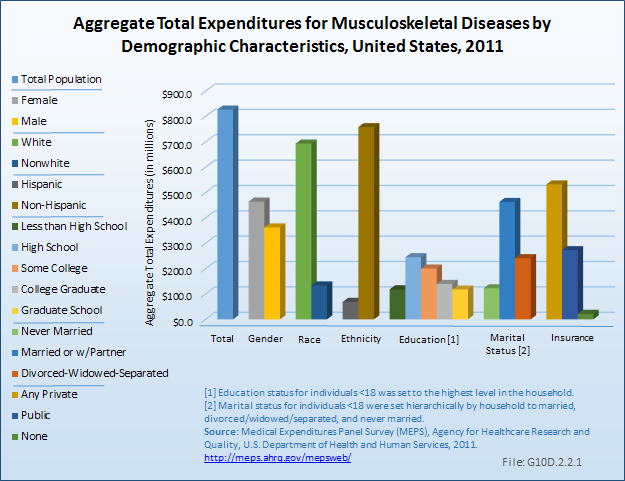
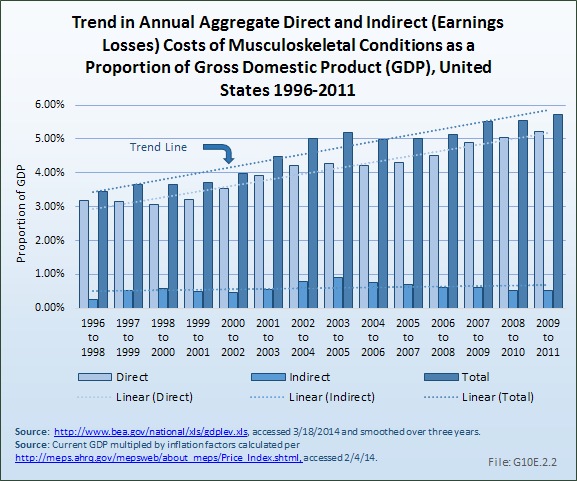
Using the more expansive definition of musculoskeletal diseases, aggregate total medical care expenditures on behalf of persons with a musculoskeletal disease were $1.068 trillion in 2009 to 2011.
Edition:
- 2014


 Download as CSV