X.C.1.3
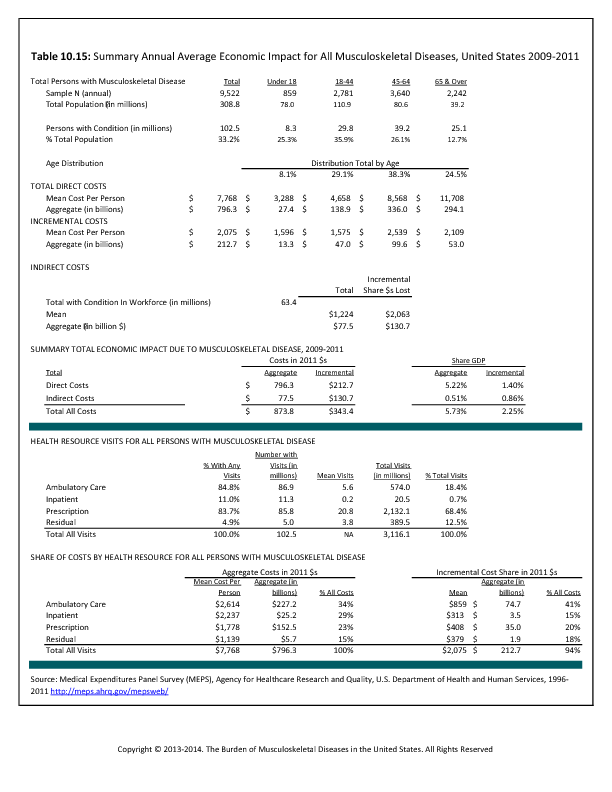
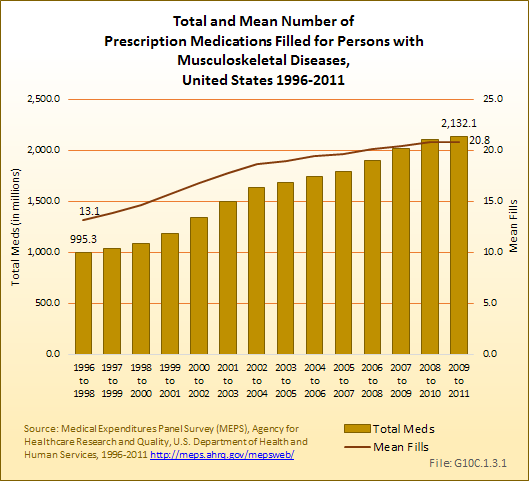
During this same time frame of 1996 to 2011, the use of prescription medications among persons with musculoskeletal diseases rose substantially. While the proportion of persons with a musculoskeletal disease who filled at least one prescription changed only slightly, from 81.3% to 83.7%, the mean number of prescriptions filled per person increased from 13.1 to 20.8. The result was a 142% increase, from 995.3 million in 1996 to 1998 to more than 2.1 billion in 2009 to -2011, in the number of prescription medications filled by persons with a musculoskeletal disease. (Reference Table 10.2 PDF CSV) 
Edition:
- 2014


 Download as CSV