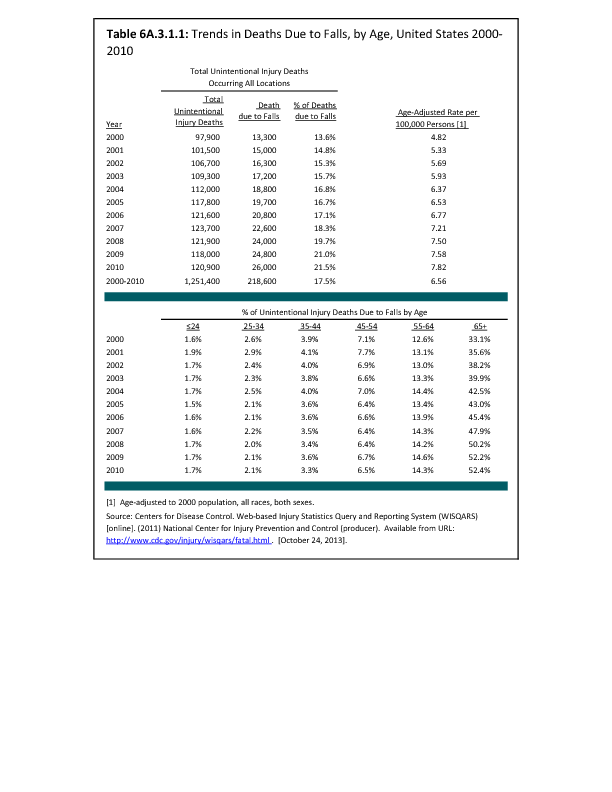
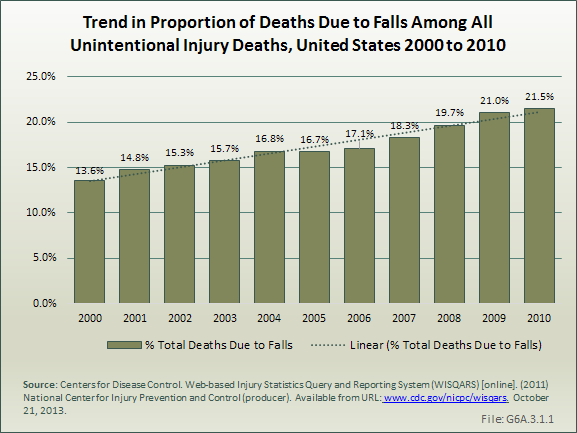
The number of unintentional deaths from injuries has remained fairly steady since the early 2000s, with 110,000 to 120,000 deaths occurring as a result of injuries each year.1 However, the proportion of these unintentional deaths that occur as a result of a fall has been steadily rising since 2000, increasing from 14% of deaths in 2000 to 24% in 2010. The age-adjusted rate2 per 100,000 persons has increased from 4.8 to 7.8 for the same time frame.
The primary cause of this increasing proportion is due to deaths from falls in the aging population. Among persons age 65 years and older, the proportion of unintentional injury deaths from falls has risen from 33% to 52% between 2000 and 2010. There has been a slight rate increase from 12% to 14% among persons age 55 to 64 years. The proportion has remained relatively steady for persons under the age of 54 years. Unintentional injuries are the top cause of death for all persons age 1 to 44 years; the third highest cause for those age 45 to 54 years; fourth highest for those age 55 to 64 years; and ninth for those age 65 years and older.3 (Reference Table 6A.3.1.1 PDF CSV)
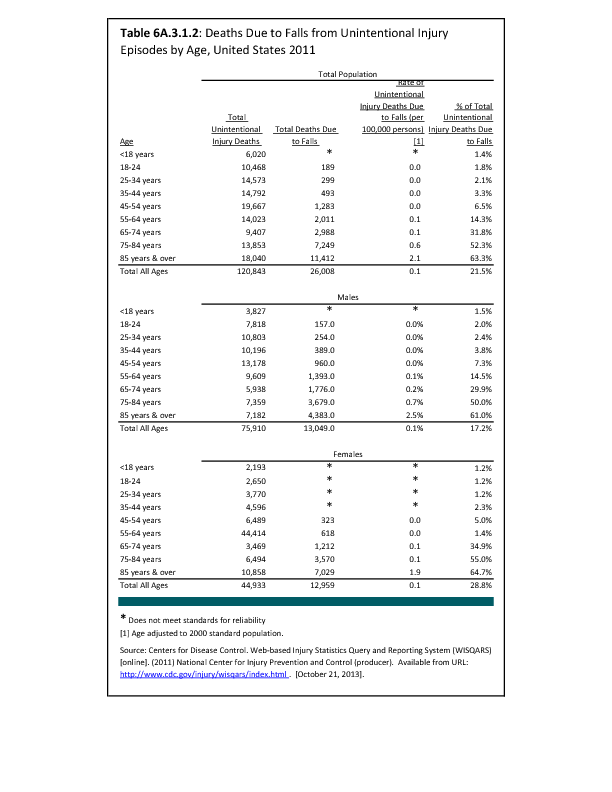
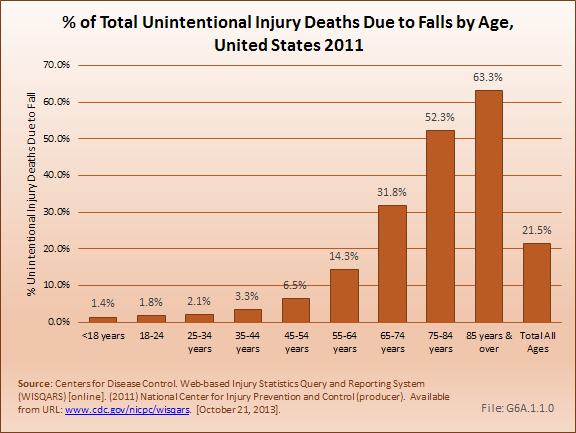
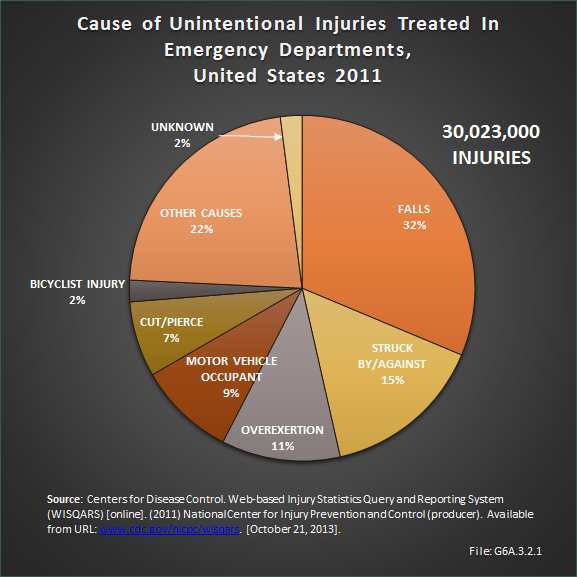
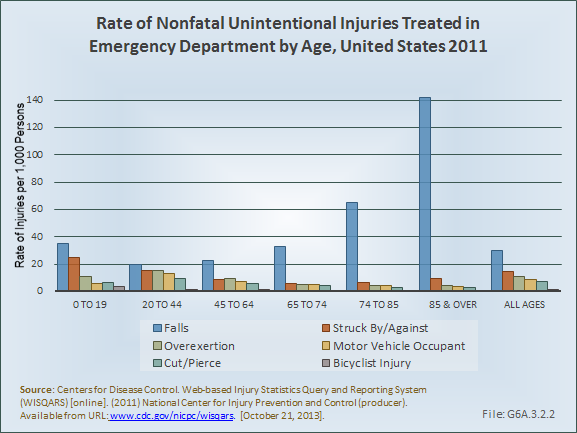
In 2011, the death rate due to unintentional injury from falls remained at 22%. Females, however, experienced a higher death rate from falls than did males (29% versus 17%). Although the number of deaths from unintentional injury is similar across age groups, both sexes show a steep increase in deaths from falls with increasing age. Among children under age 18 years, the proportion of deaths from falls among all unintentional injury deaths is only 1.4%. Among persons age 85 years and older, it is 63%. (Reference Table 6A.3.1.2 PDF CSV)
- 1. Centers for Disease Control: Web-based Injury Statistics Query and Reporting System (WISQARS) (2011). National Center for Injury Prevention and Control. Available from URL: http://www.cdc.gov/injury/wisqars/ Accessed October 24, 2013.
- 2. Age-adjusted to the 2010 US Census Population. Age-adjusting rates is a way to make fairer comparisons between groups with different age distributions. For example, a county having a higher percentage of elderly people may have a higher rate of death or hospitalization than a county with a younger population, merely because the elderly are more likely to die or be hospitalized. A standard population distribution is used to adjust death and hospitalization rates. The age-adjusted rates are rates that would have existed if the population under study had the same age distribution as the standard population. You cannot compare adjusted rates that use different standard populations, for example, a different Census year.
- 3. Centers for Disease Control: Web-based Injury Statistics Query and Reporting System (WISQARS) (2011). National Center for Injury Prevention and Control. "20 Leading Causes of Death, United States 2010, All Races, Both Sexes". Available at: http://www.cdc.gov/injury/wisqars/ Accessed October 24, 2013.
Edition:
- 2014


 Download as CSV