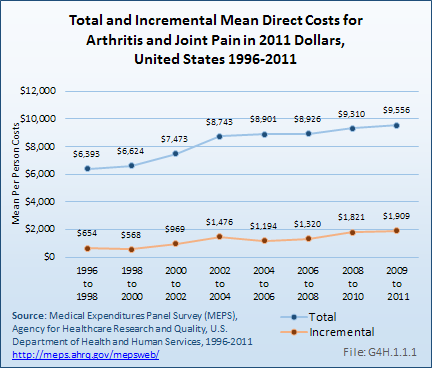
For total medical expenditures, mean per-person expenditures for arthritis and joint pain increased from an average of $6,393 in the years 1996 to 1998 to an average of $9,556 from 2009 to 2011 in 2011 dollars. For incremental medical expenditures, mean per-person expenditures for arthritis and joint pain increased from an average of $654 in the years 1996 to 1998 to an average of $1,909 in 2009 to 2011 in 2011 dollars. The change in total mean expenditures was 50%, while incremental mean expenditures rose by 192%. (Reference Table 10.6 PDF CSV)
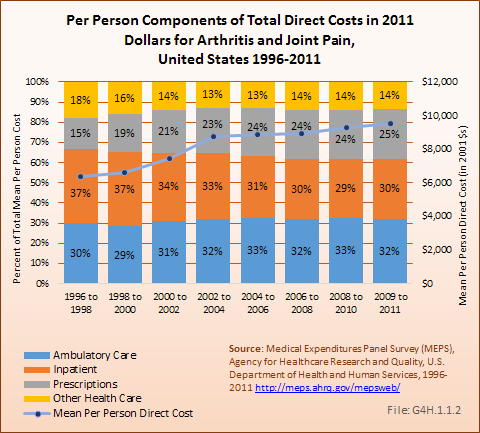
Mean per person direct costs include ambulatory care, inpatient care, prescriptions, and other health care costs. In 2011, ambulatory care and inpatient care each accounted for about a third of per person direct costs, with prescriptions accounting for another 25%. Over the past 15 years, prescription costs have seen the greatest change, rising nearly 60% per person in that time. Both inpatient and other health care costs went down by 20% and 23%, respectively. (Reference Table 10.4 PDF CSV)
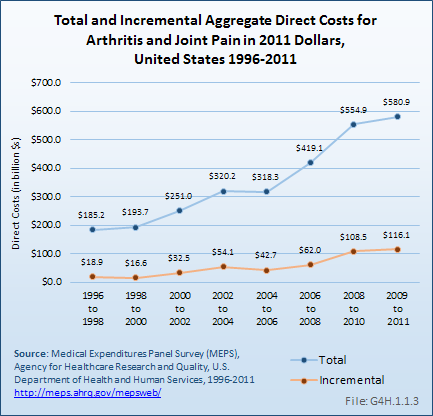
Total aggregate medical expenditures for people treated for all causes, including a diagnosis of arthritis and joint pain, in the United States increased from $185.2 billion in 1996 to 1998 to $580.9 billion in 2011 dollars, on average, for the years 2009 to 2011. Aggregate medical expenditures specifically attributed to arthritis and joint pain (incremental costs) in the United States increased from $18.9 billion in 1996 to 1998 to $116.1 billion in 2011 dollars, on average, for the years 2009 to 2011. While the increase over the 15-year period for total aggregate costs was more than 200%, the increase for incremental aggregate costs was greater than 500%. (Reference Table 10.6 PDF CSV)
Mean and aggregate total and incremental direct and indirect costs for two types of arthritis using the annual average for years 2008 to 2011 MEPS data are calculated.
Edition:
- 2014

 Download as CSV