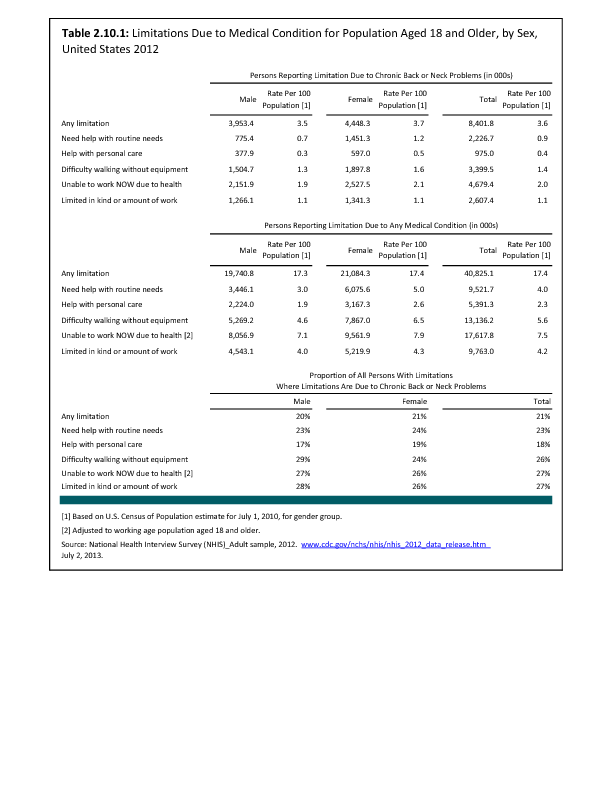
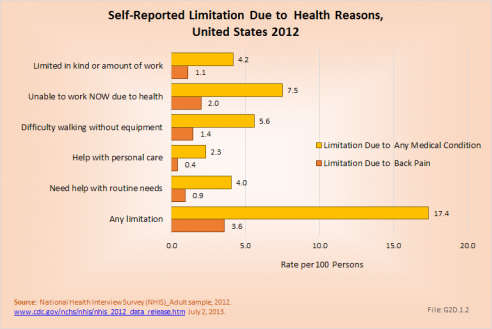
About 8% of the working age population, persons age 18 years and older, reported they are unable to work because of a medical condition. Among this group, 27% (2% of total working-age population) reported they are unable to work due to back or neck problems. Another 4% reported they are limited in the amount or type of work they can perform, with one in four of this group also reporting the cause to be back or neck pain (1% of total work-age population). All together, 1 person among every 30 of working age in the United States is limited or unable to work because of back or neck health care problems.
Similar ratios of limitations related to daily living are also found. About 1 in every 18 persons of working age has difficulty walking without equipment due to a medical condition; 26% report that condition to be back or neck pain. Overall, one in six working-age persons report at least one limitation with activities of daily living, which include eating, preparing food, bathing, rising from a chair, walking up steps, etc. For one in five of these persons, the cause of their limitation is back or neck pain. (Reference Table 2.10.1 PDF CSV)
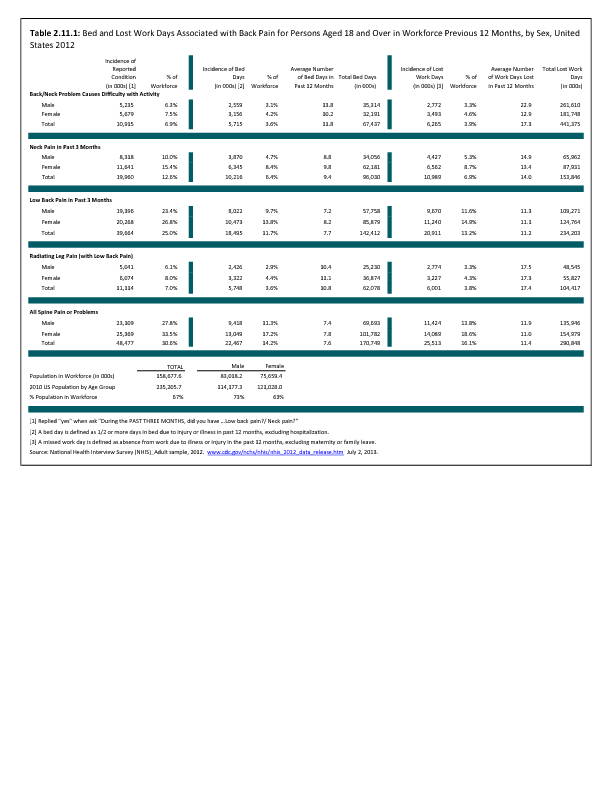
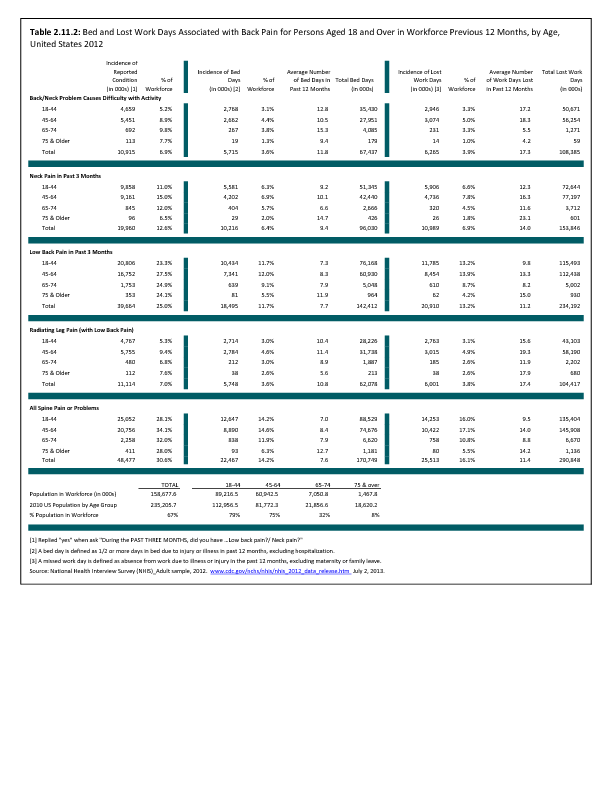
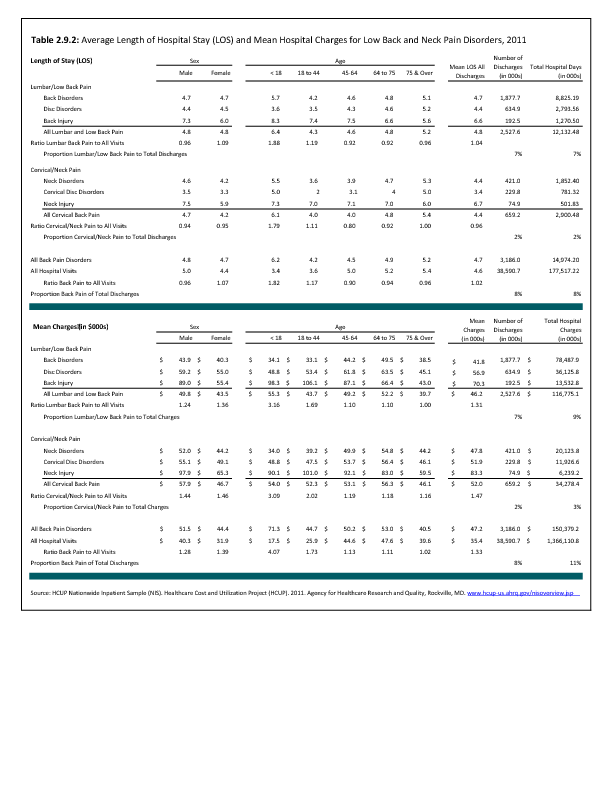
Work limitations due to back pain during 2012 were reported slightly more frequently among women than men. The presence of back pain in more than one site, for example, low back and neck pain or low back and buttocks pain, is more likely to be the cause of work limitations than back pain in one single area of the spine. Although women are represented in the workforce less than men, they represent a larger share of lost work days than do men because they are more likely to report lost work days due to back pain than are men (18.6% vs. 13.8%). However, women, on average, lose one less day of work than do men (11.0 to 11.9, respectively). (Reference Table 2.11.1 PDF CSV) 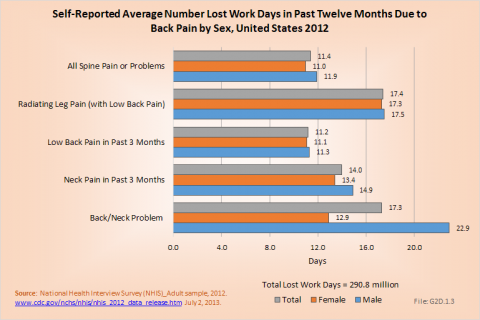
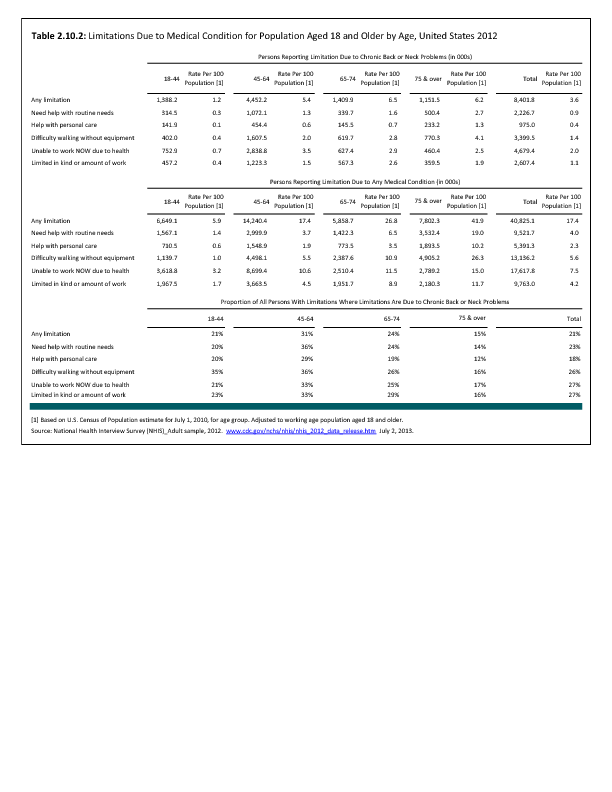
Back pain severe enough to keep people from working in any occupation is most likely in the 18- to 64-year age group. This is, of course, not surprising since those are the most common years in which people work. Only 8% of the population age 75 years and older is listed as being in the workforce, and those persons of this age that do work are probably not doing work that stresses them physically. Further, the healthy worker effect in that age group is significant. Within the work force population, 16% of the workers age 18 to 44 years and 17.1% of workers between 45 and 64 years of age were off work during 2012 with a diagnosis of neck or low back pain. The average number of workdays lost was 9.5 and 14 days for the two age groups, respectively. The oldest group of workers report more than 14 days off work due to back pain, but they constitute such a small group their impact is less than that of the younger workers. (Reference Table 2.11.2 PDF CSV)
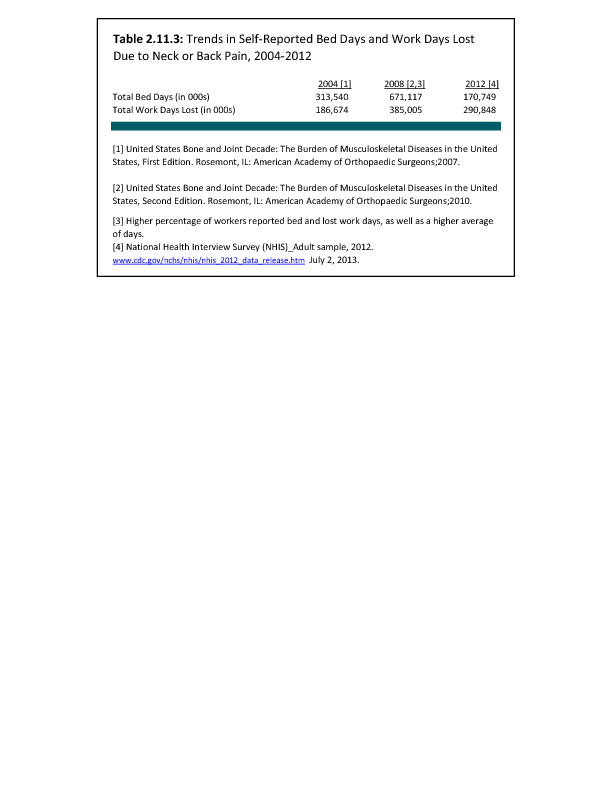
The National Health Care Interview Survey also provides information about the incidence of bed days, days in which a person was in bed for a half day or more due to injury or illness, during 2012. Here the percent of people reporting bed days is highest in the 18- to 44-year and 45- to 64-year age groups (14.2% and 14.6%, respectively). The greatest number of average bed days per worker was 12.7 in the 75-year and older age group, but a smaller proportion (6.3%) of this already small workforce reported having bed days from back or neck pain. In total, workers in the United States spent more than 170,000 million days in bed in 2012 because of back pain, and during the same time period, almost 291 million workdays were lost. The corresponding number of workdays lost in 2004 was 187 million workdays. (Reference Table 2.11.2 PDF CSV and Table 2.11.3 PDF CSV)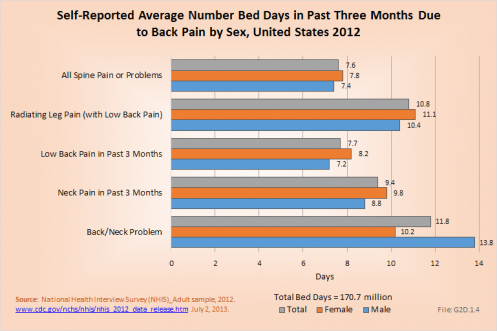
The most severe pain resulting in the highest average number of bed days and lost workdays was reported by people with low back pain radiating into one or both legs. This group spent an average of 10.8 days in bed and lost 17.4 workdays. Females were more commonly off work, but spent approximately the same number of days in bed as males. (Reference Table 2.11.1 PDF CSV)
Edition:
- 2014


 Download as CSV