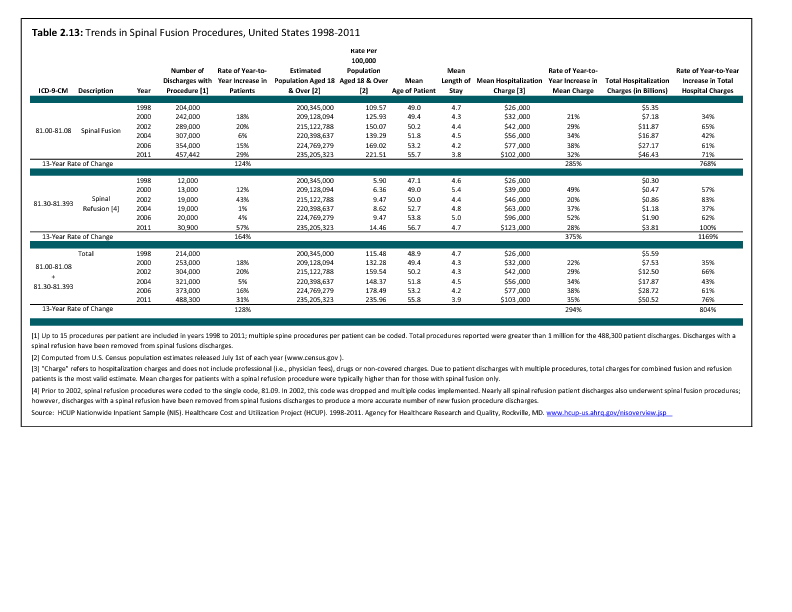
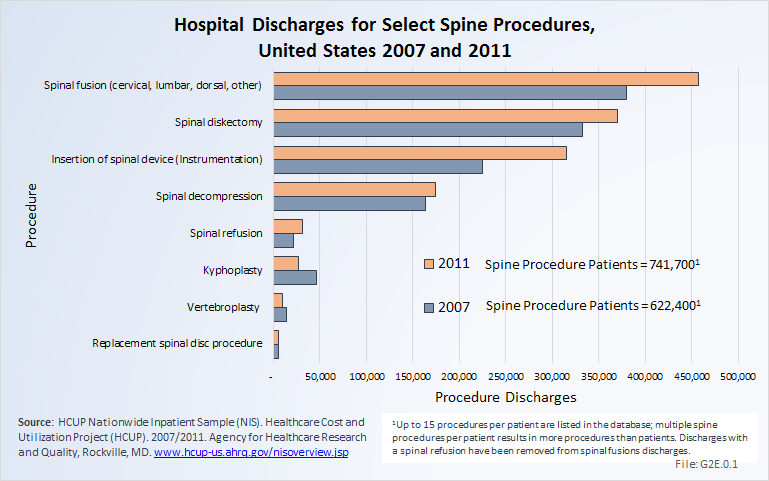
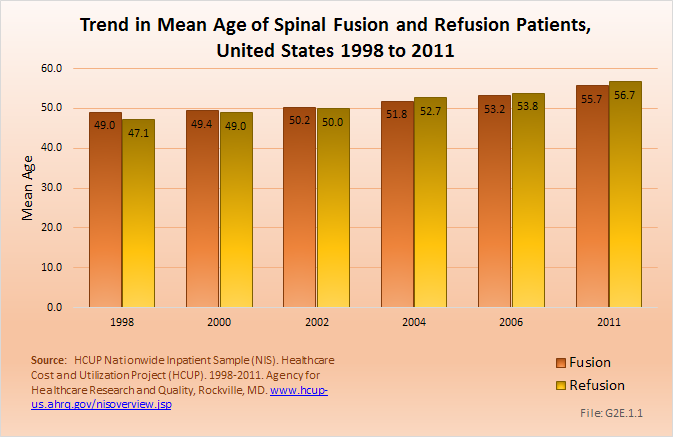
The rate of spinal fusion procedures has risen rapidly over the past several decades. Spinal fusion is performed either alone or in conjunction with decompression and/or reduction of a spinal deformity. Fusions are performed on all regions of the spine. Between the years 1998 and 2011, the number of spinal fusion procedures has more than doubled, from 204,000 in 1998 to 457,000 in 2011. This is a 14-year increase of 113%. Apart from the period from 2002 to 2004, the increase on a biyearly basis is in the double digits. Relating the number of patients operated on to the estimated population age 18 years and older, the rate has gone from 110 per 100,000 persons in 1998 to 199 per 100,000 in 2011. During the same time period, refusion rates increased by 171%, from 6 to 14 persons per 100,000. Between 1998 and 2011, the average age of patients operated on with a fusion procedure has increased from 49 years to just under 56 years. (Reference Table 2.13 PDF CSV)
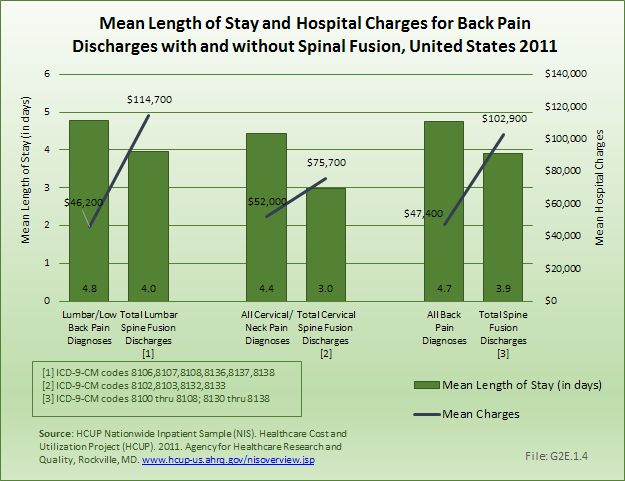
Although the mean length of stay for spinal fusion has decreased from 4.7 days in 1998 to 3.8 in 2011, the hospital charges for these patients have increased significantly. The mean hospitalization charge in 1998 was $26,000 ($36,000 in 2011 dollars); while in 2011 the charge was $102,000. An increased use of instrumentation and biologicals (mainly bone substitutions) contribute to the higher cost. The total increase in hospitalization charges rose from $5.4 billion ($7.4 billion in 2011 dollars) to $46.4 billion over this 14-year period, an increase of more than 750%. Spinal refusions are even more expensive, with an average charge of $123,000 in 2011. However, because spinal refusions are a small proportion of all fusion procedures, they account for only 7.5% of total 2011 charges. This, of course, does not mean that cost or reimbursement was even close to these dollar numbers. These charges are based on what hospitals set as their charges, and do not reflect the contractual agreements they have with the payor community.
Likely explanations for the increase in spinal fusions are advances in technology, including the development of new diagnostic techniques and new implant devices that allow for better surgical management. In addition, there has been increased training in spinal surgery and the population has aged, bringing with it the inherent medical problems that aging incurs. Further, quality of life expectations have increased, making patients less accepting of an ongoing back problem and more likely to look for a surgical solution.
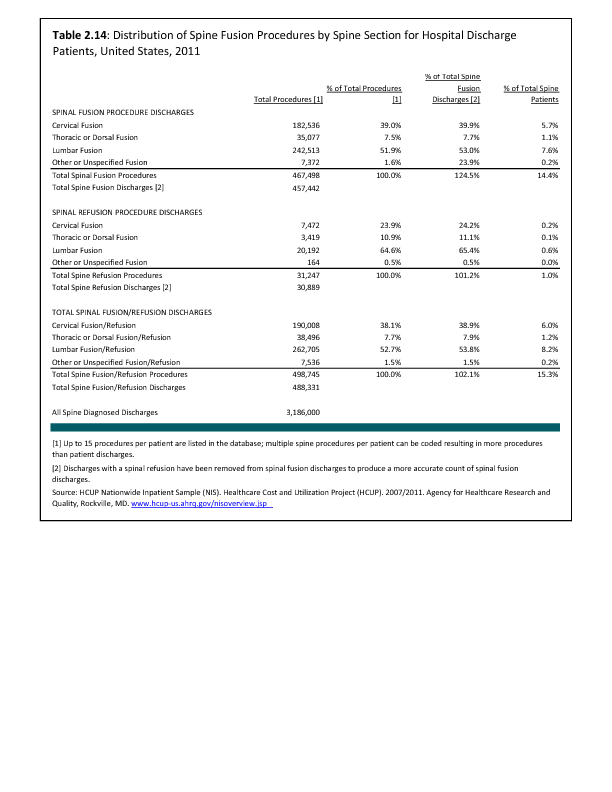
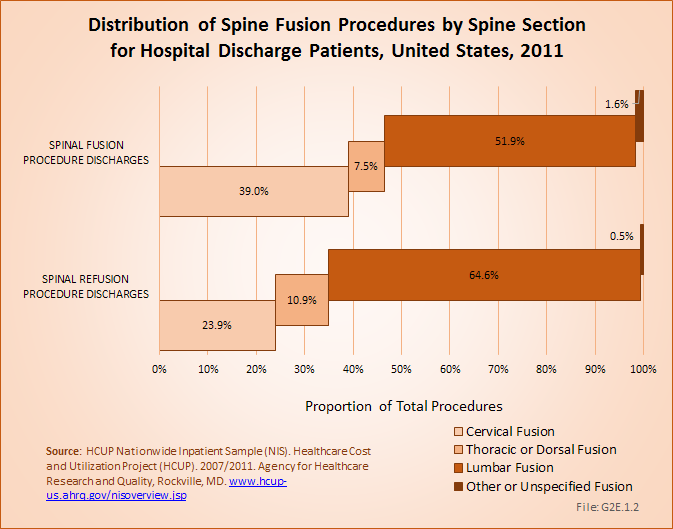
Lumbar fusion rates and cervical fusion rates are both increasing rapidly, while thoracic fusions continue to be less frequent. Lumbar fusions remain the most common, constituting 52% of all spine fusion procedures in 2011. Spinal refusions occur most often to the lumbar region, accounting for 65% of both refusion procedures and refusion patients. (Reference Table 2.14 PDF CSV)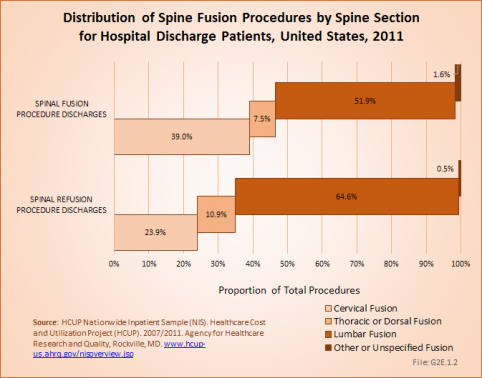
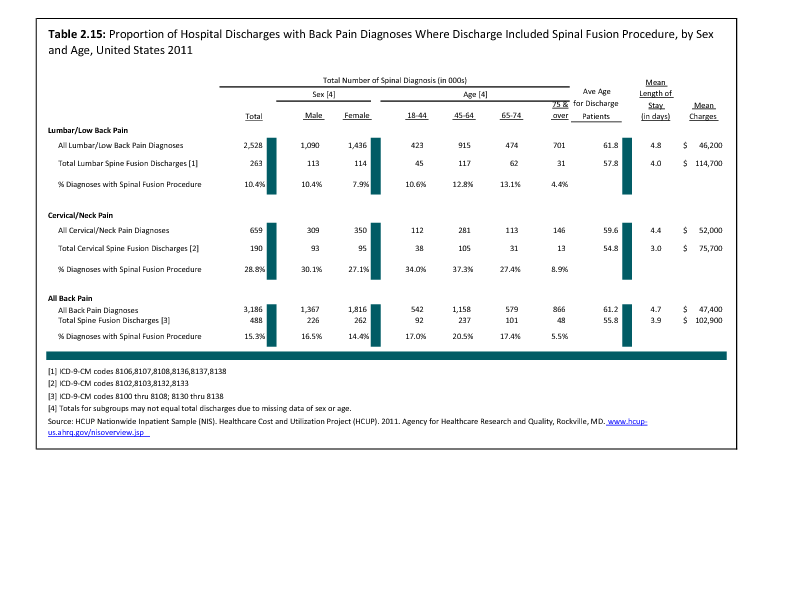
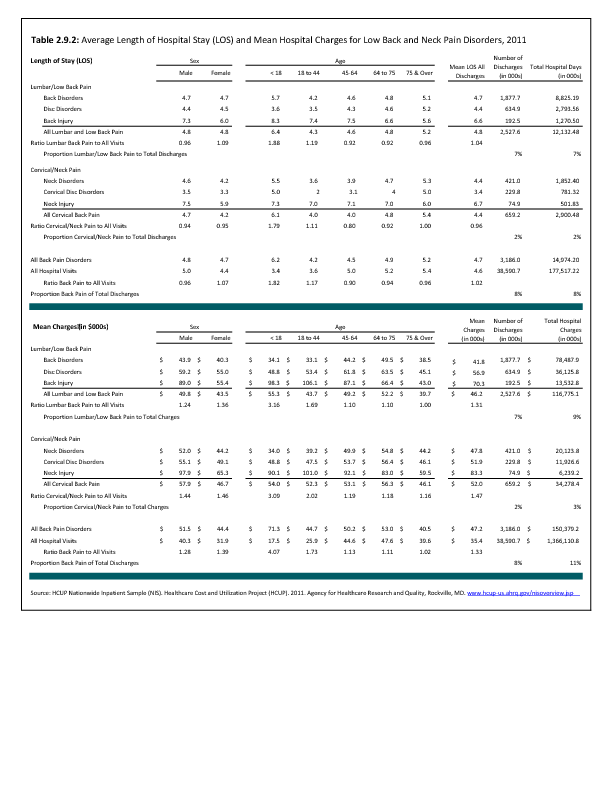
Using the Nationwide Inpatient Sample in 2011, a broad estimate can be made of fusion procedures as it relates to admissions. In 2011, 10.4% of patients with low back diagnosis were operated on with a fusion. For cervical neck pain diagnoses, the proportion is much higher (28.8%). Males and females are almost equally likely to have a fusion. The total number of males being fused for either neck or low back pain is 16.5% versus 14.4% among females. Patients in the 45- to 64-year age group were slightly more likely to have a fusion procedure than those younger or older. The length of stay was less if a fusion was performed than if no fusion was performed, but the mean charges were more than double when a fusion was performed. (Reference Table 2.15 PDF CSV)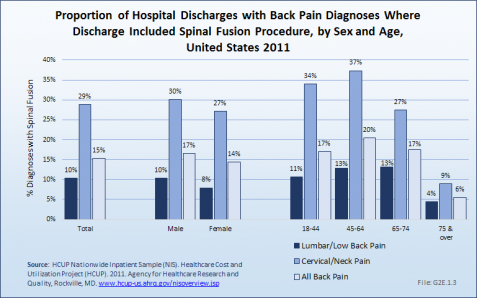

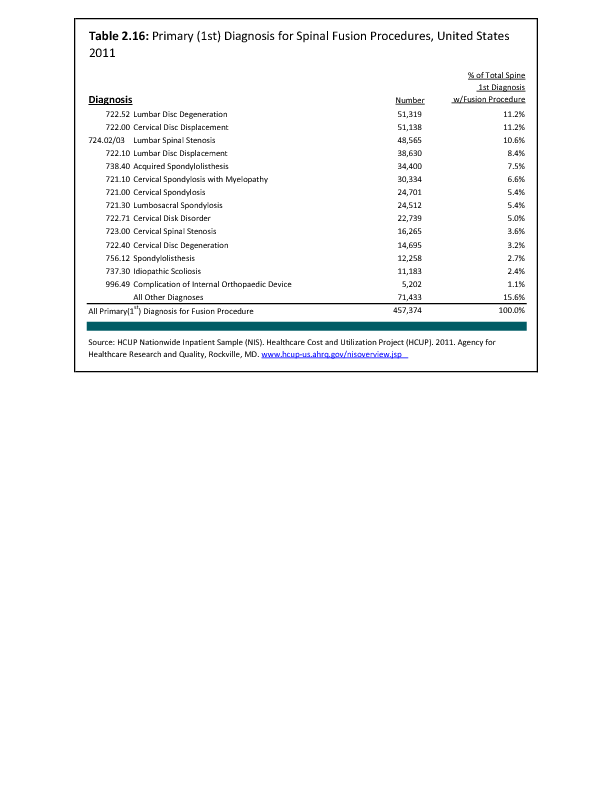
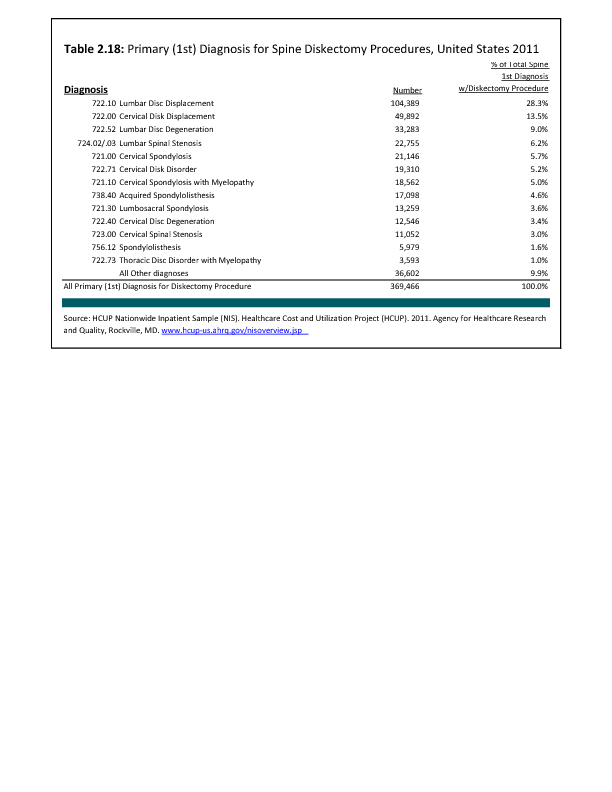
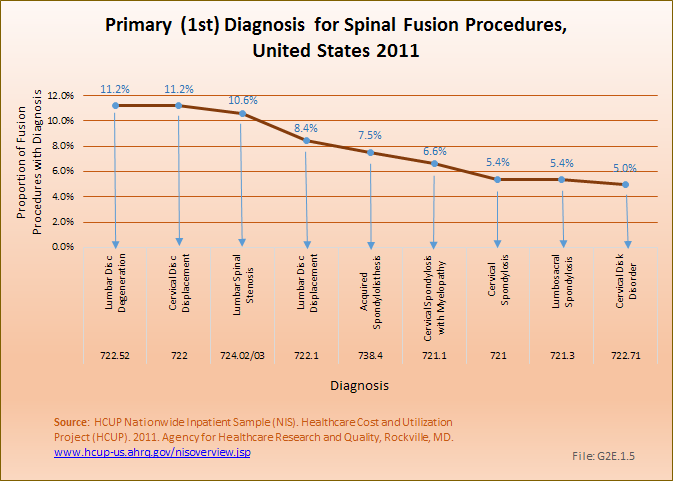
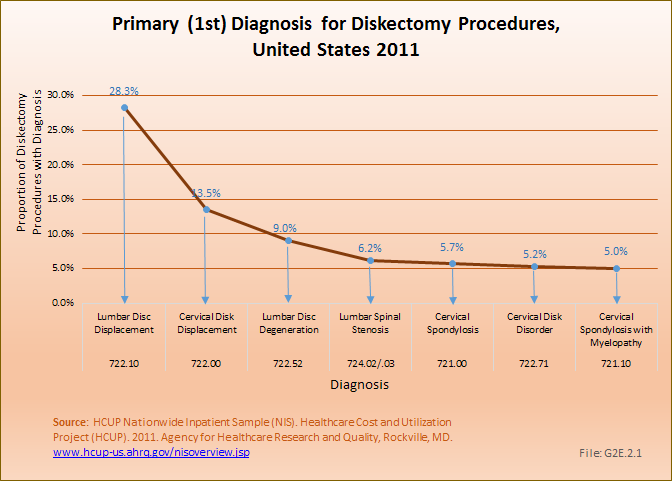
Spinal fusion is most frequently performed in patients with either a primary diagnosis of lumbar disc degeneration or cervical disc displacement, both accounting for 11.2% of fusion procedures. Spinal stenosis accounted for 10.6%. Much smaller numbers of patients had degenerative spondylolisthesis (7.5%), idiopathic spondylolisthesis (2.7%), or idiopathic scoliosis (2.4%). (Reference Table 2.16 PDF CSV)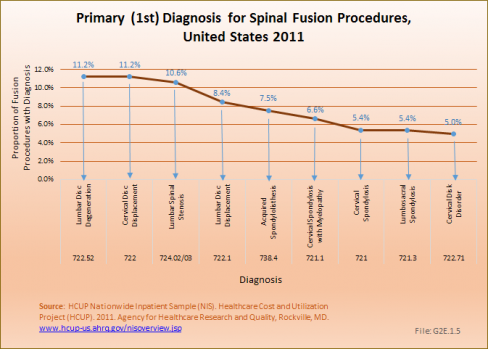
Edition:
- 2014


 Download as CSV