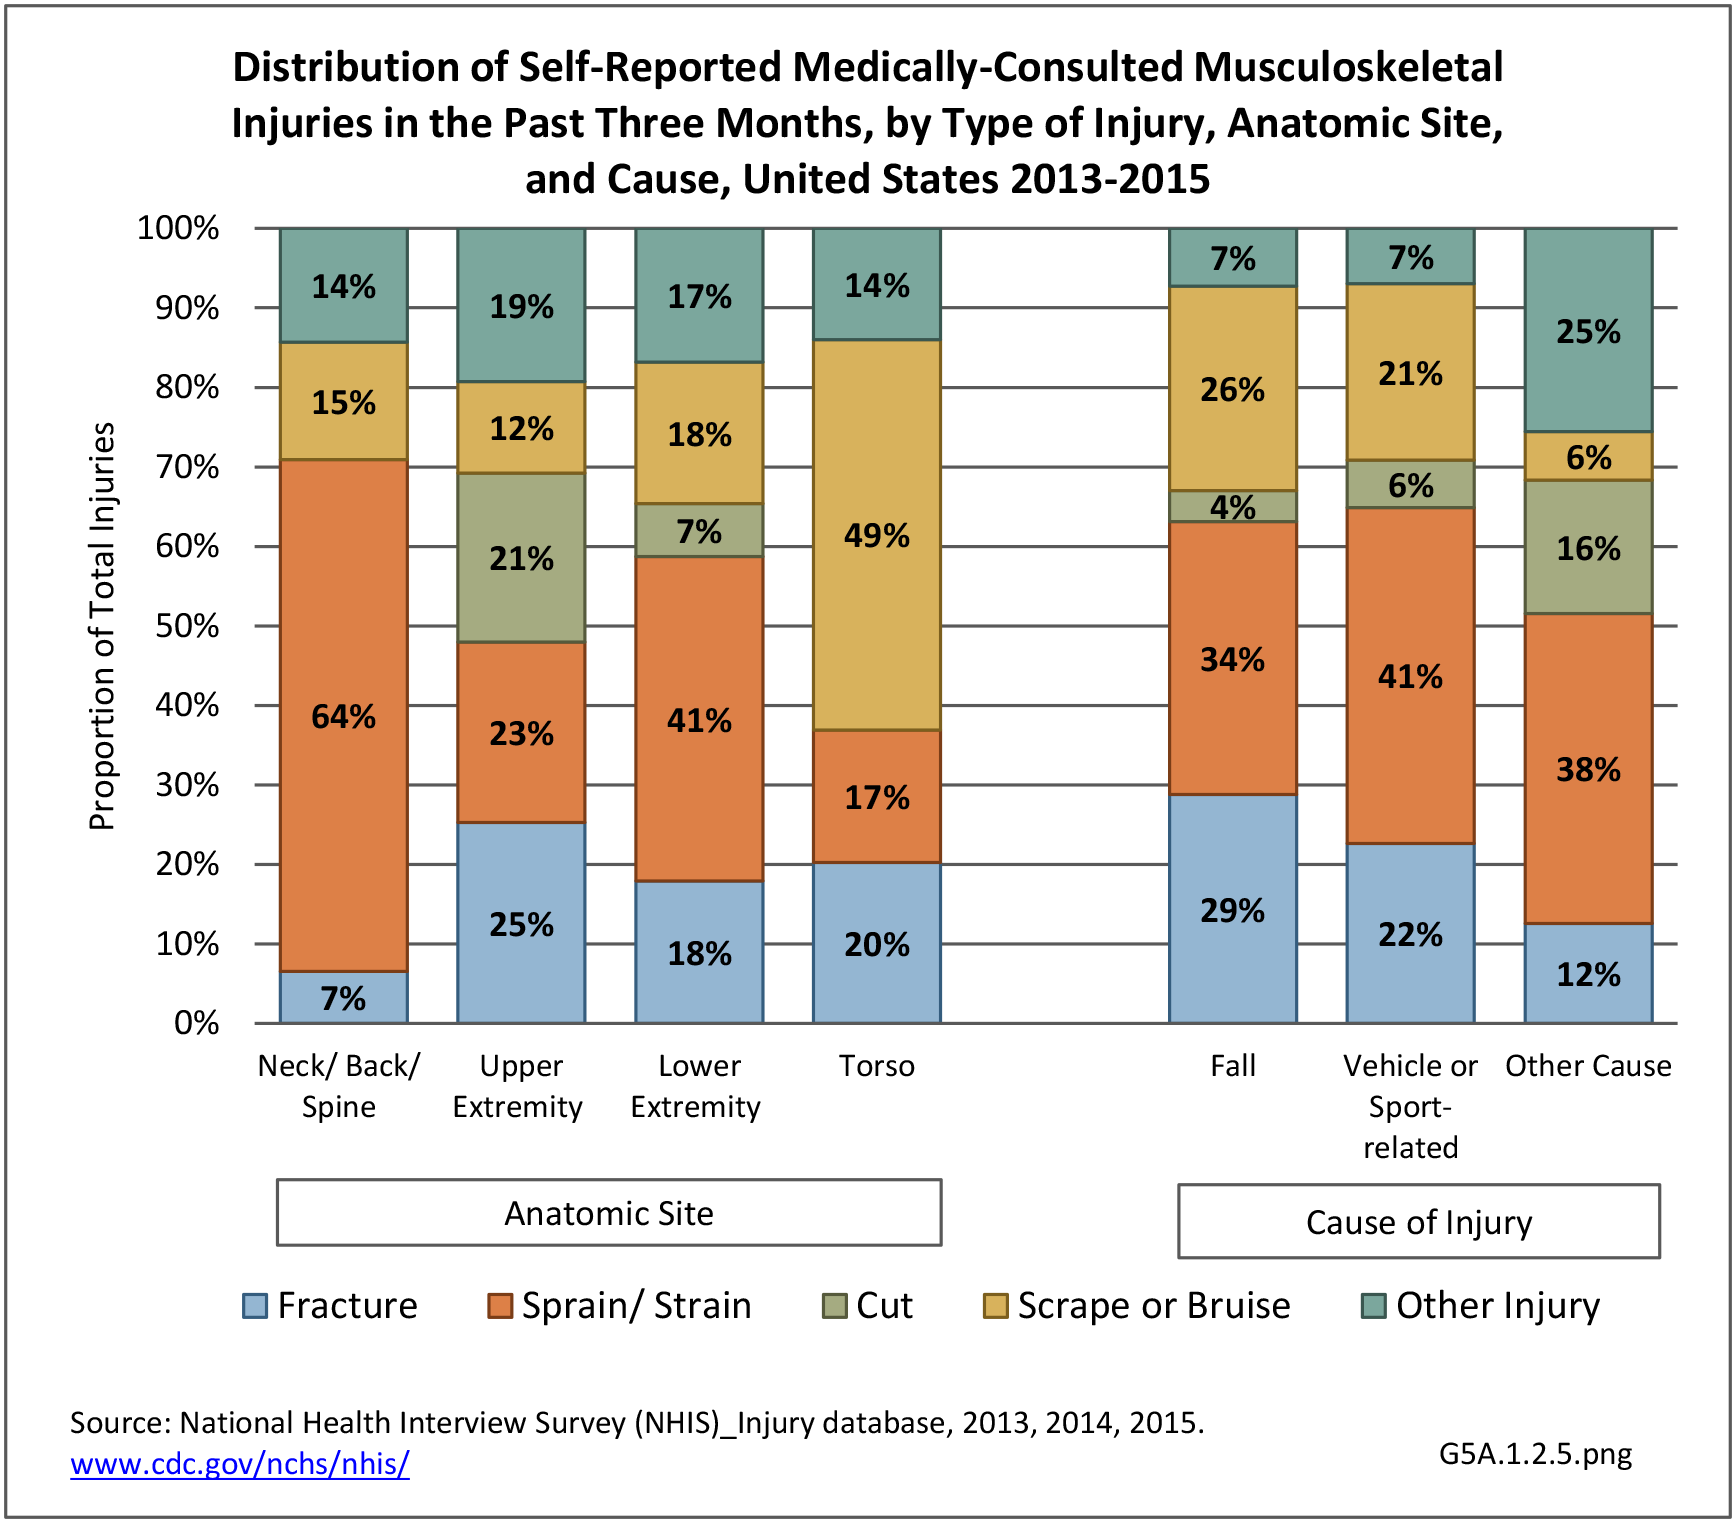
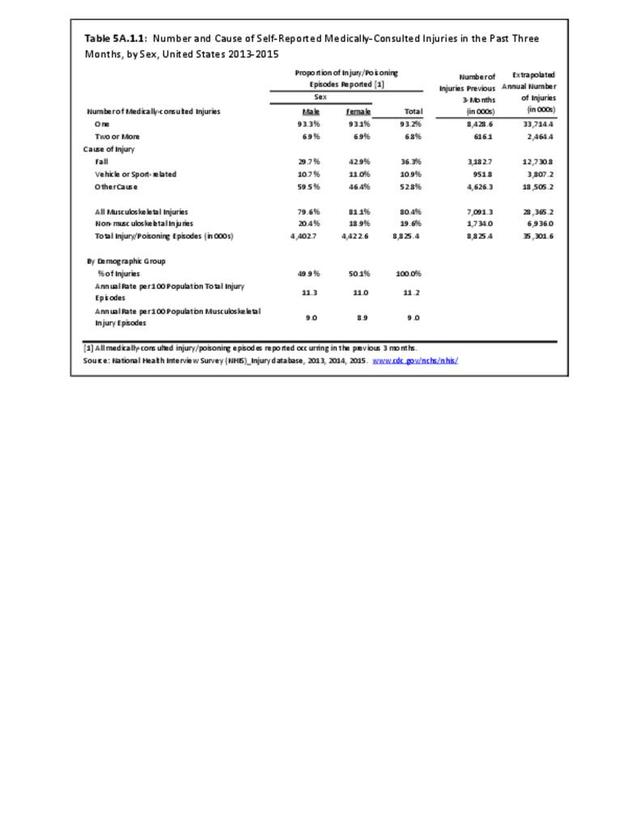
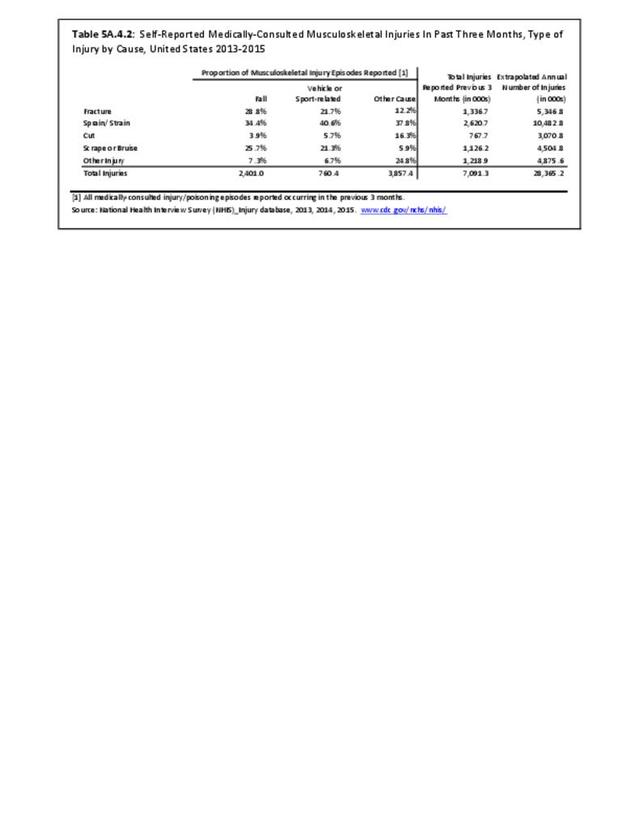
When reporting the cause of their injury, respondents are asked about six specific causes and an “other” cause. Approximately one-half of respondents reply with the “other” response, which includes accidents around the home and while conducting activities of daily living. In compiling data on the cause of injury, only three categories are used. “Falls” is one of the six specific causes; “vehicle or sports-related” injuries include being in a motor vehicle collision or as a pedestrian hit by a vehicle, accidents while in a boat, train or airplane, and accidents while on a scooter, bike, skateboard, horse, etc. Burns are included in the “other” cause category.
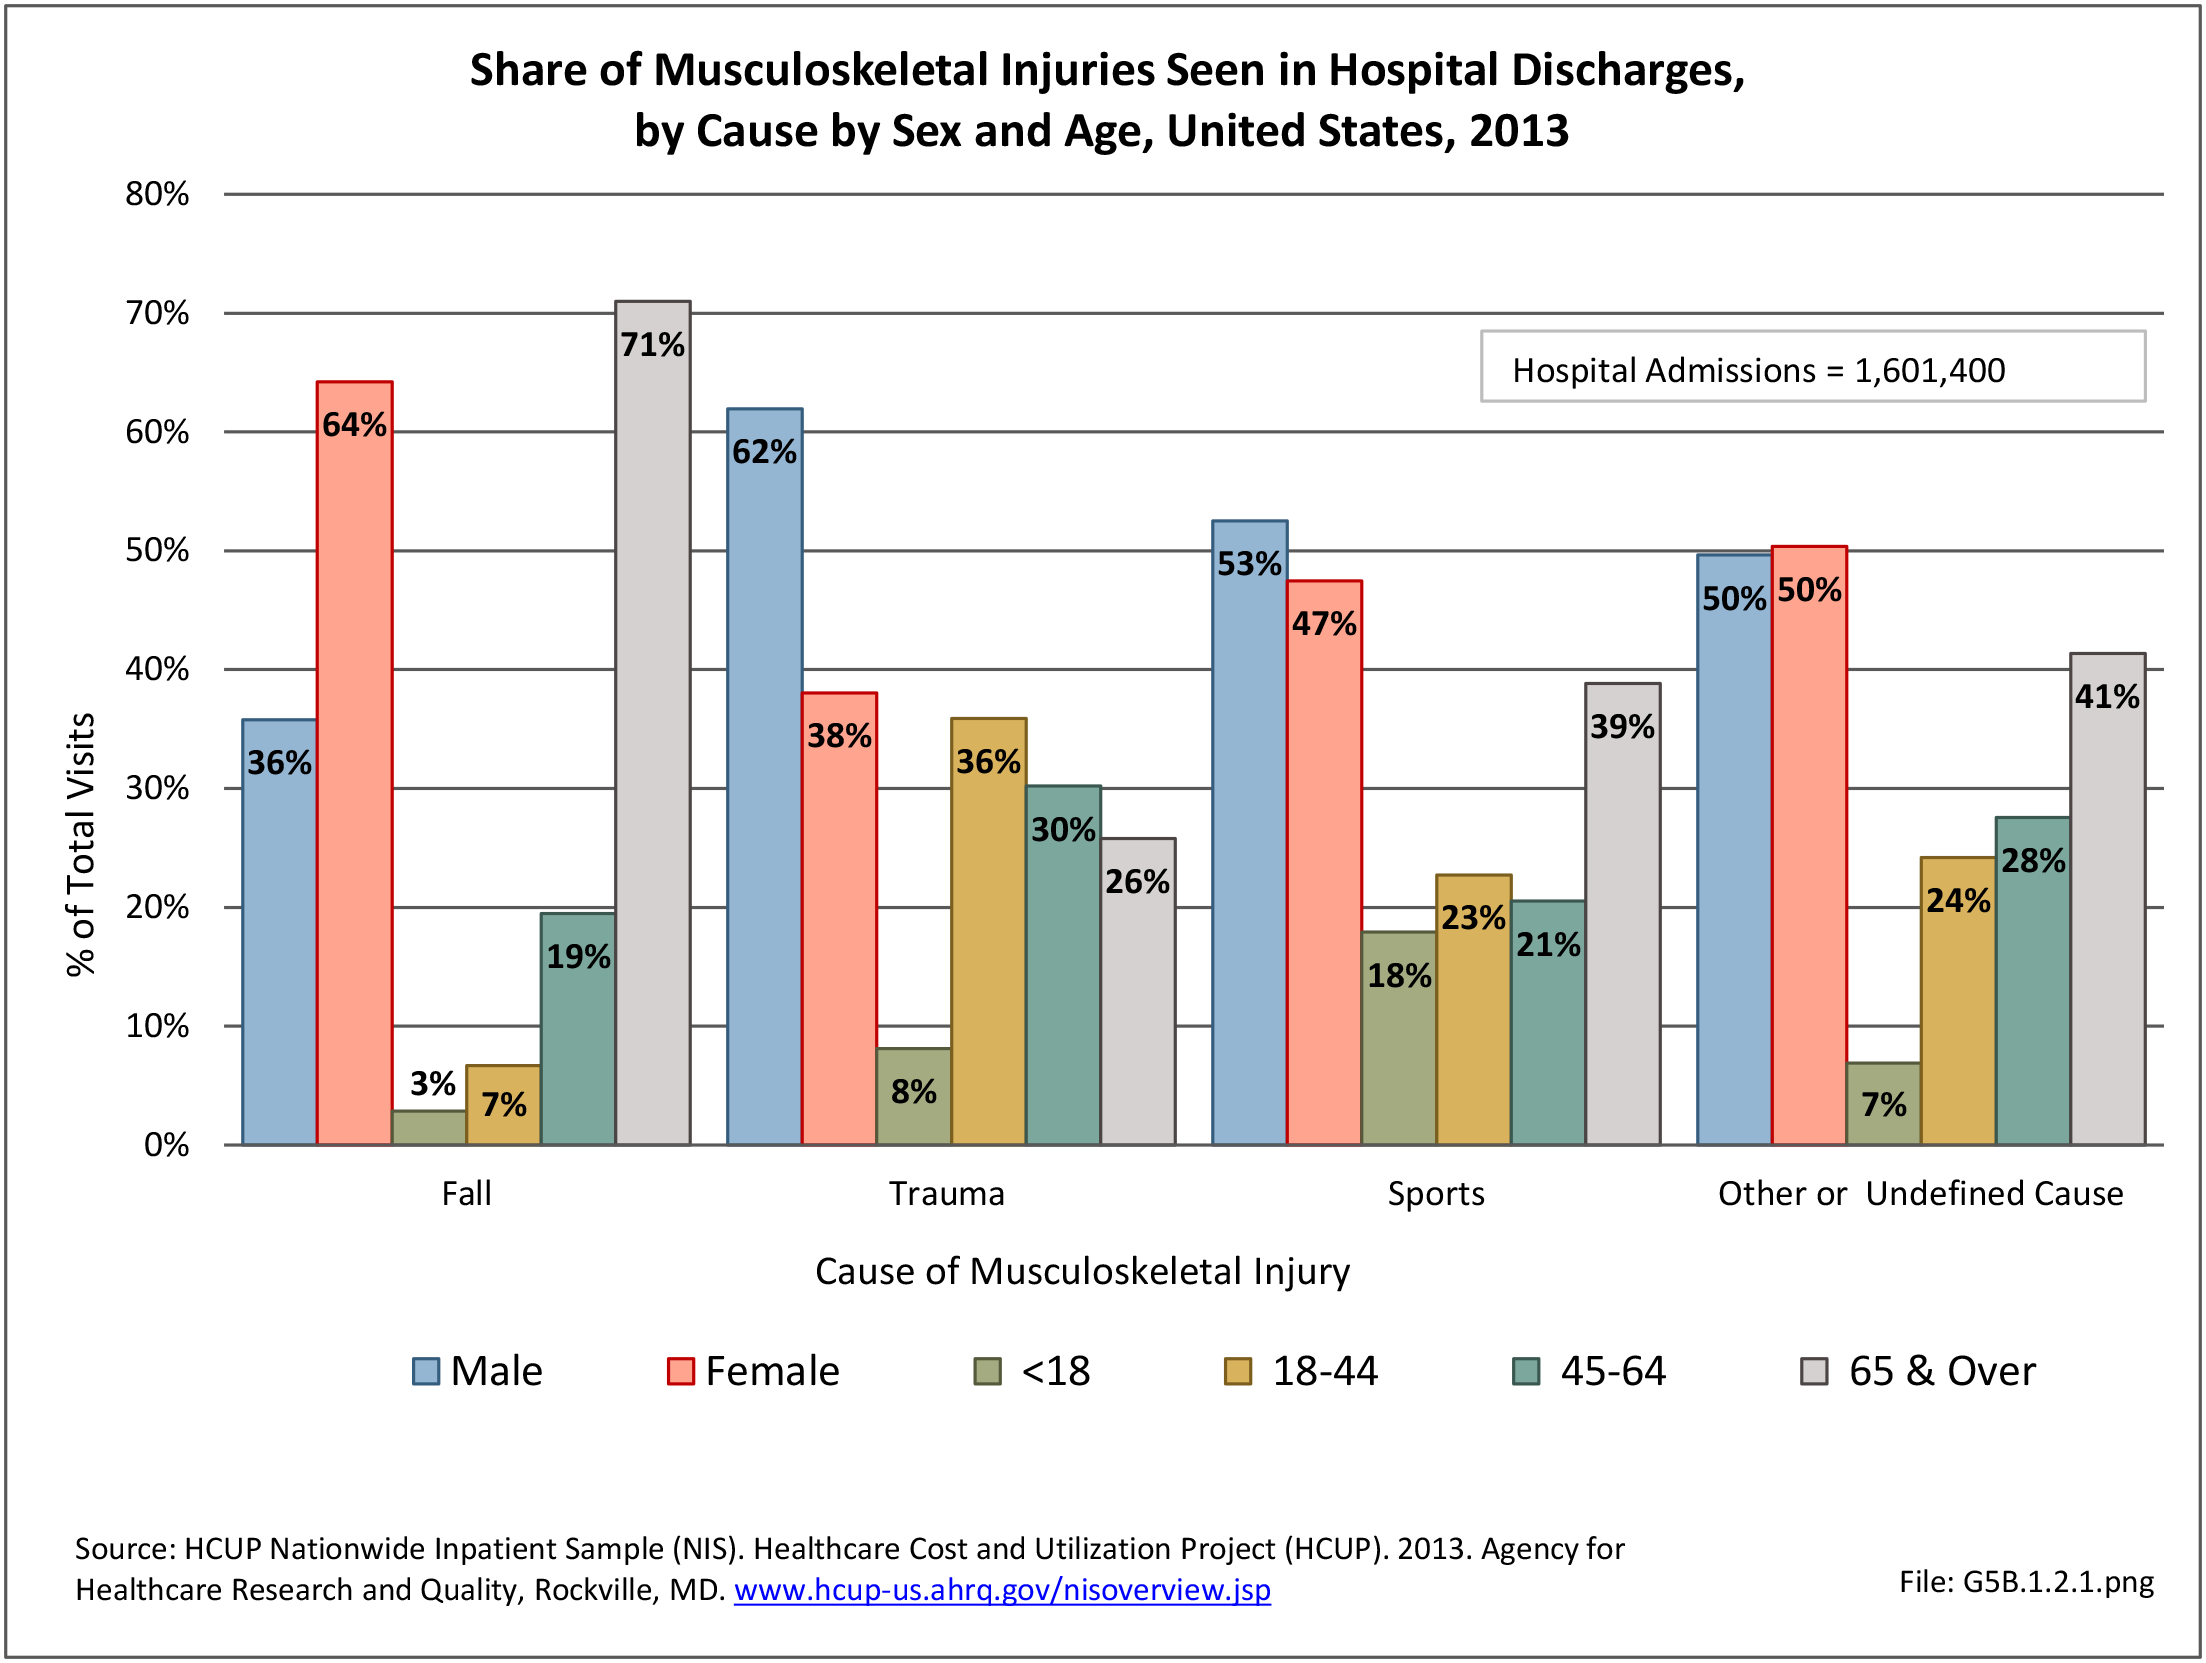
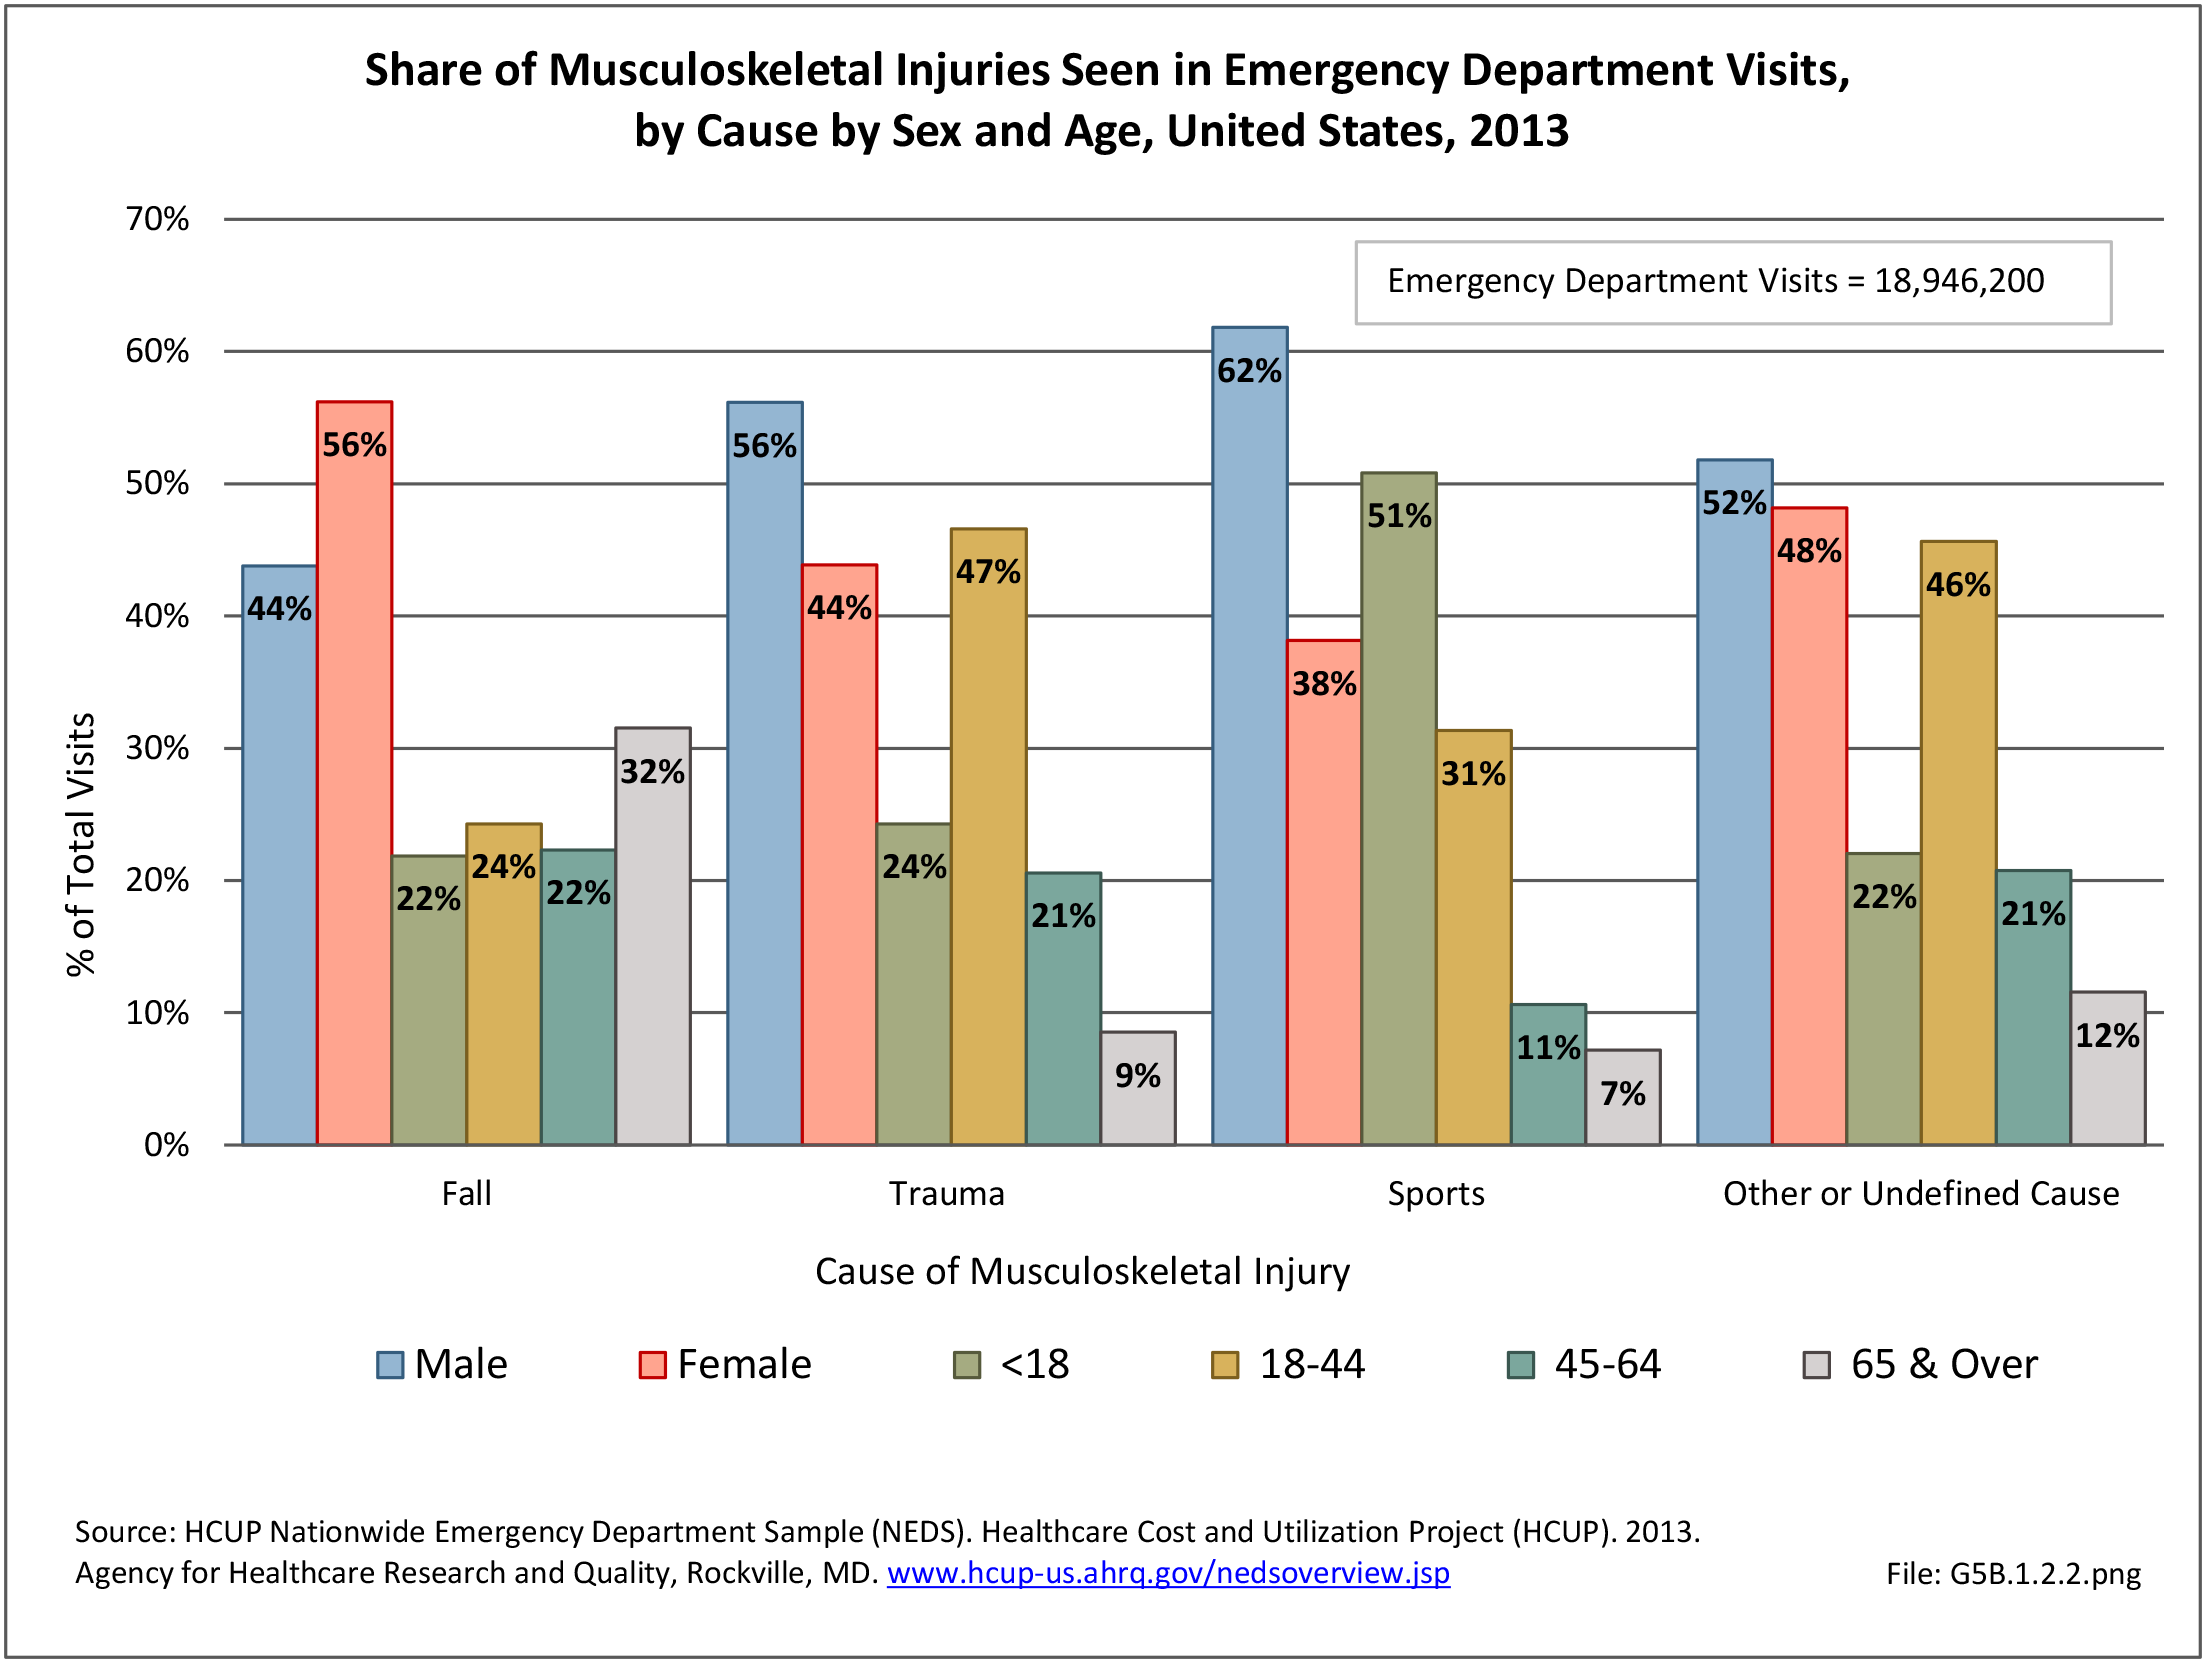
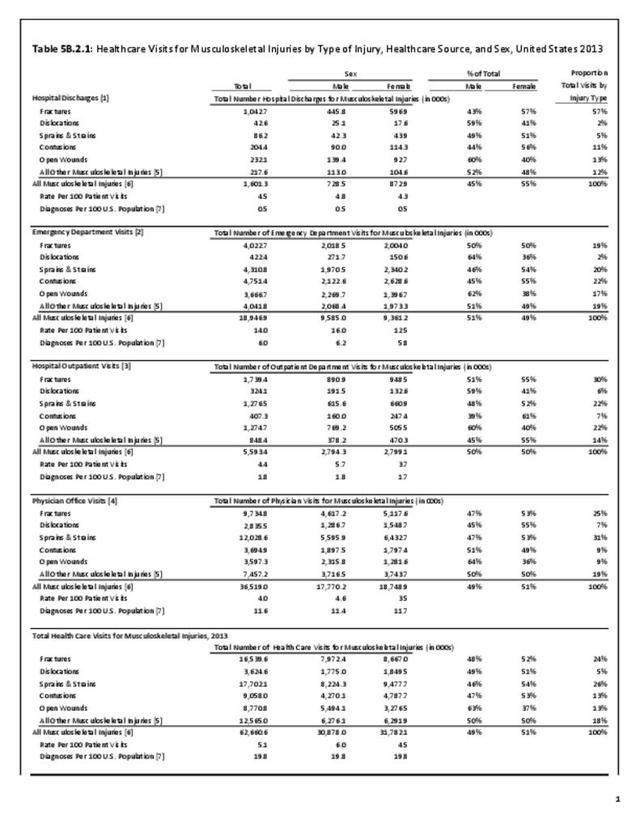
The cause of all injuries reported by male and female individuals is 11% each for vehicle or sports-related injuries. However, women report more falls than men (43% versus 30%) and fewer other causes (46%, 60%). (Reference Table 5A.1.1 PDF CSV)

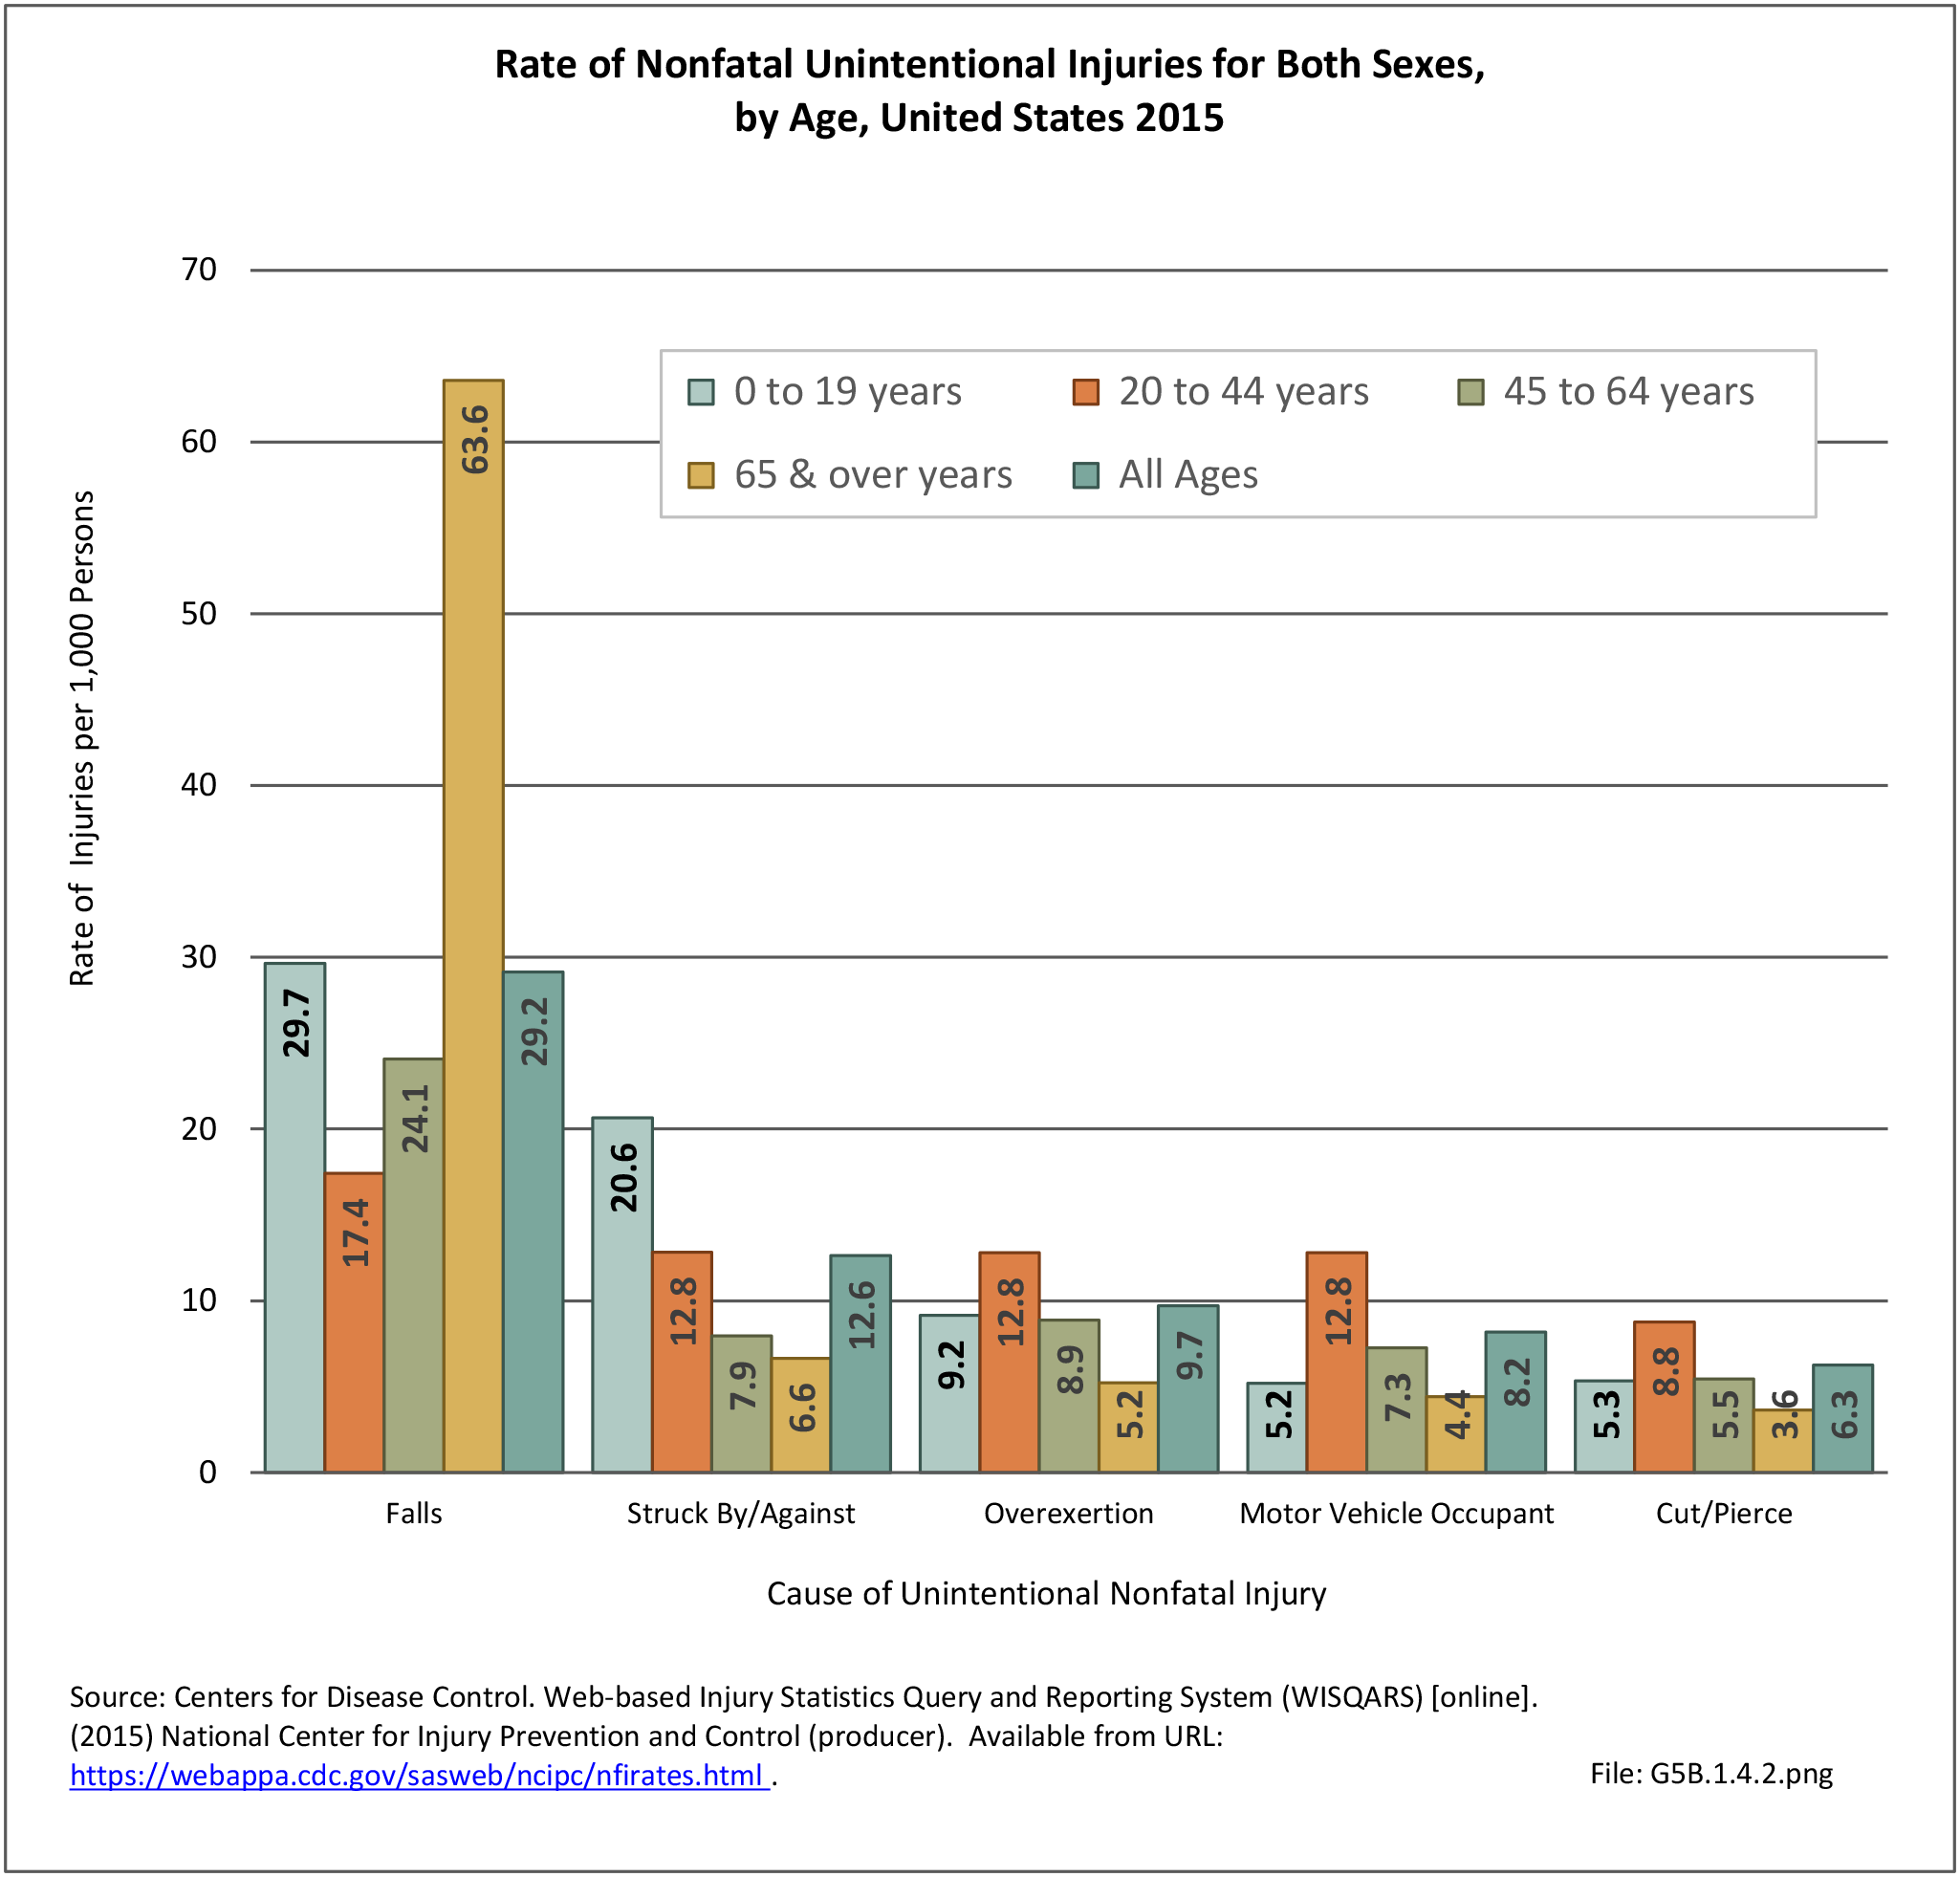
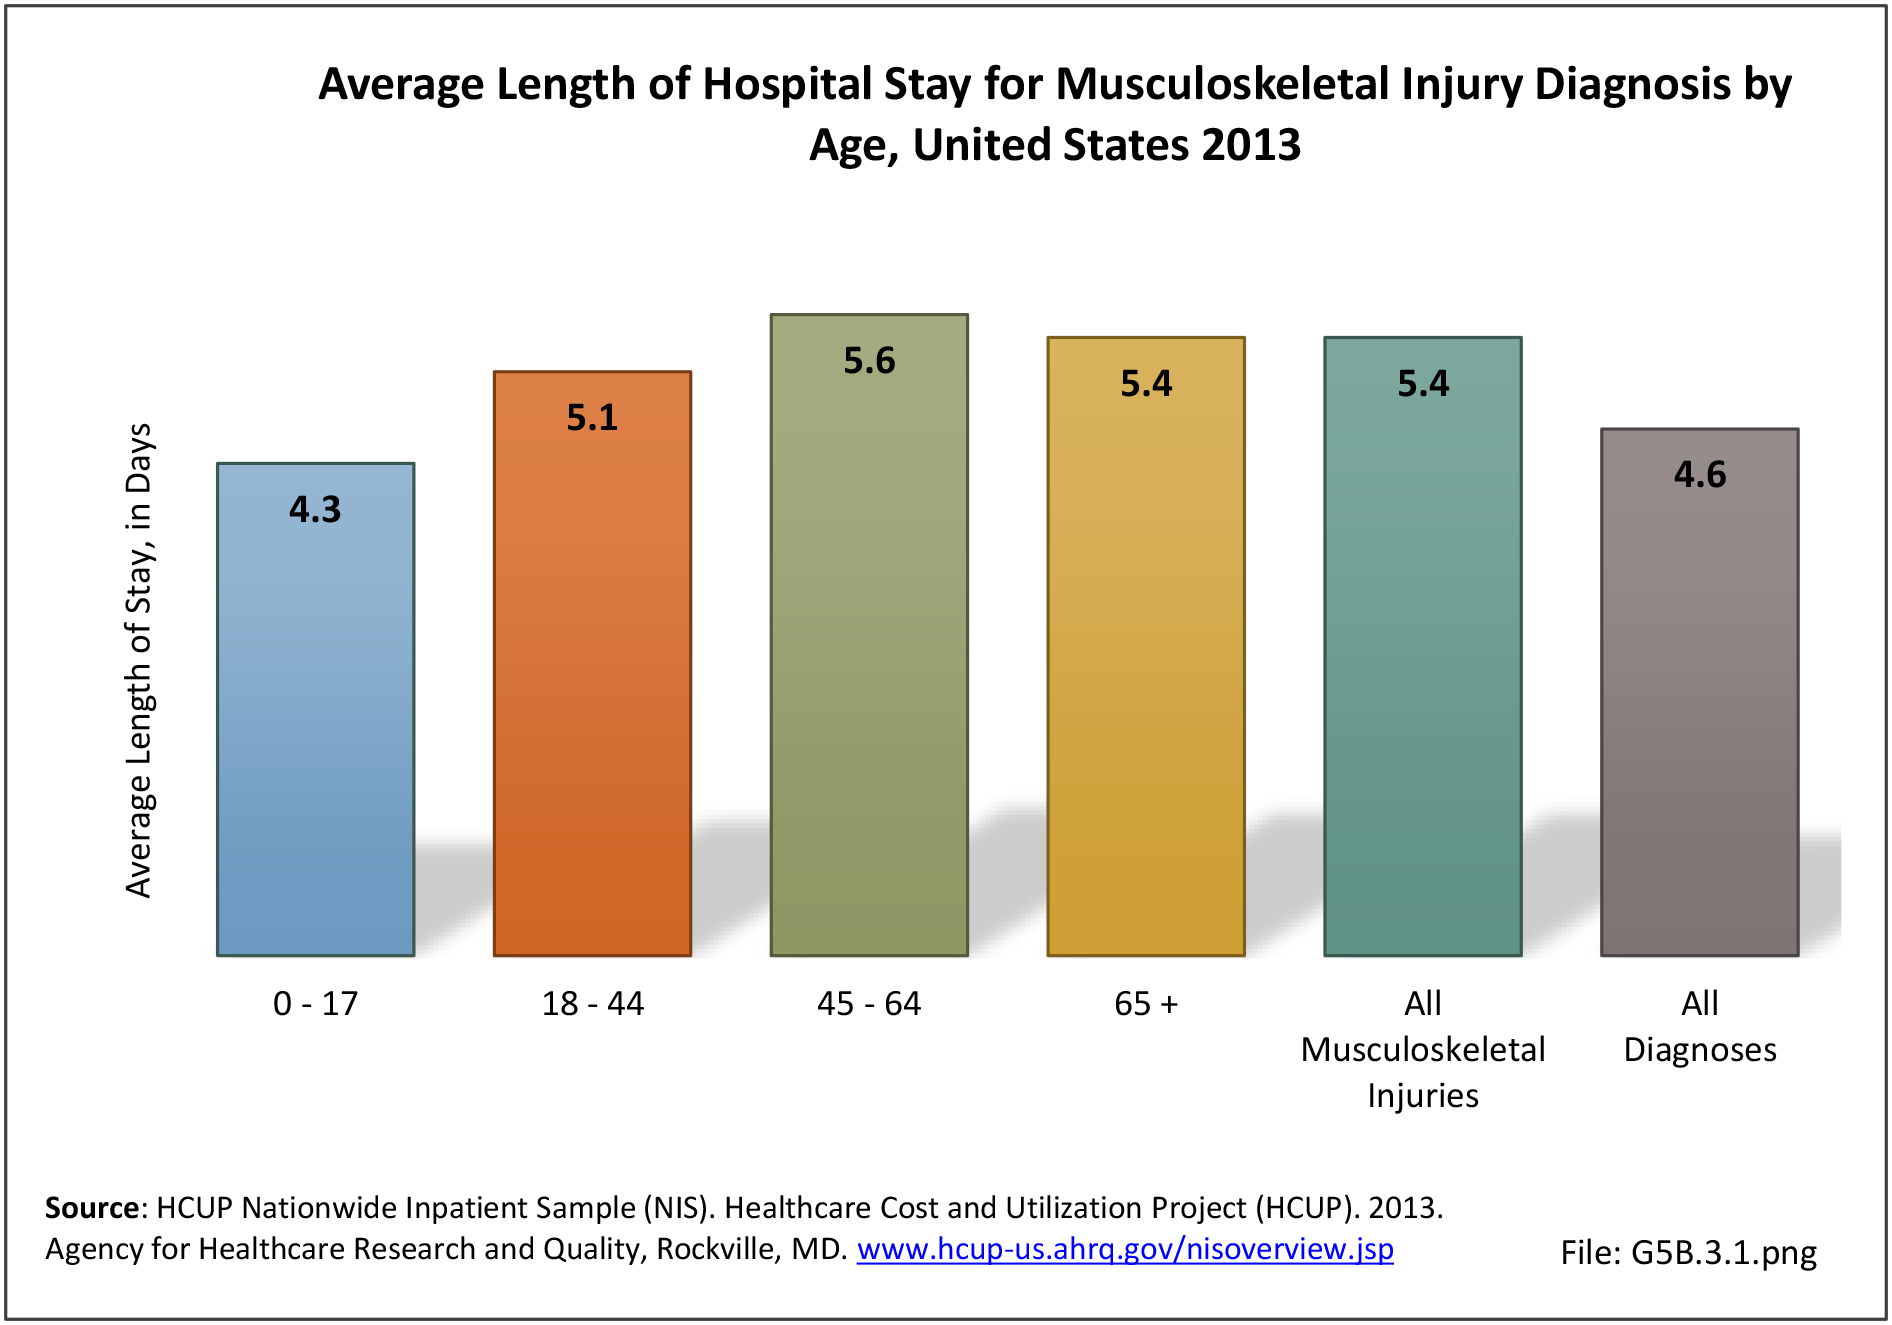
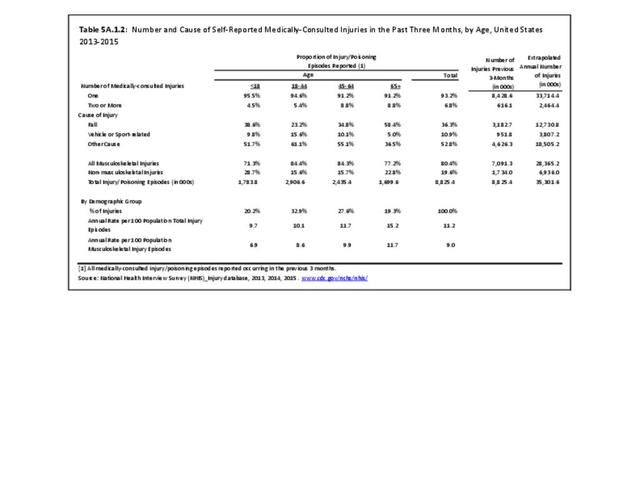
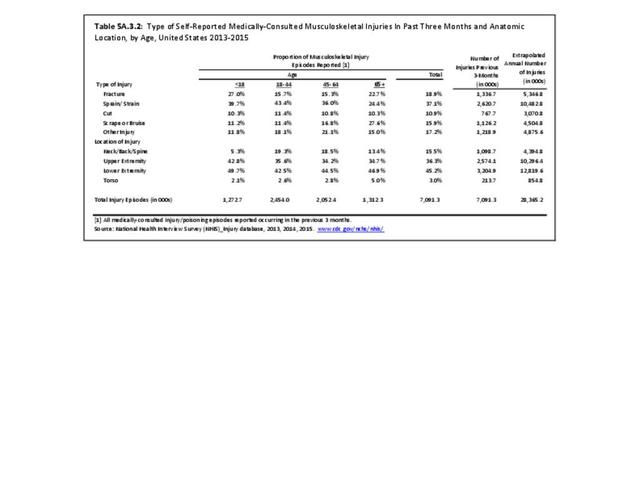
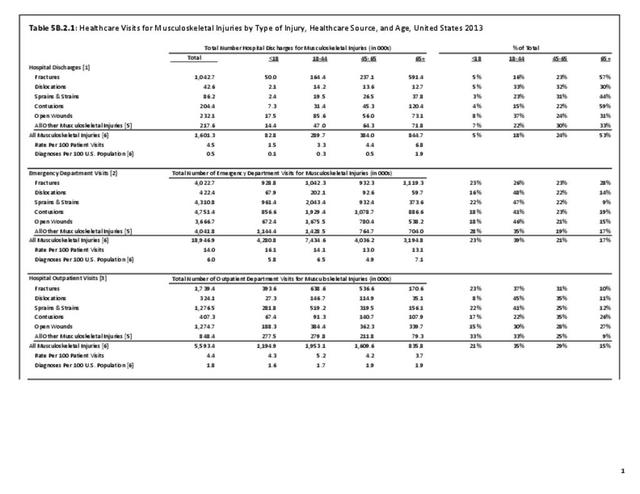
By age, persons age 18 to 44 report higher incidence of vehicle and sport-related injuries (15.6%), while those age 65 and over report only 5% from this cause. However, the 65 and over population reports the highest incidence of falls (58.4%). (Reference Table 5A.1.2 PDF CSV)

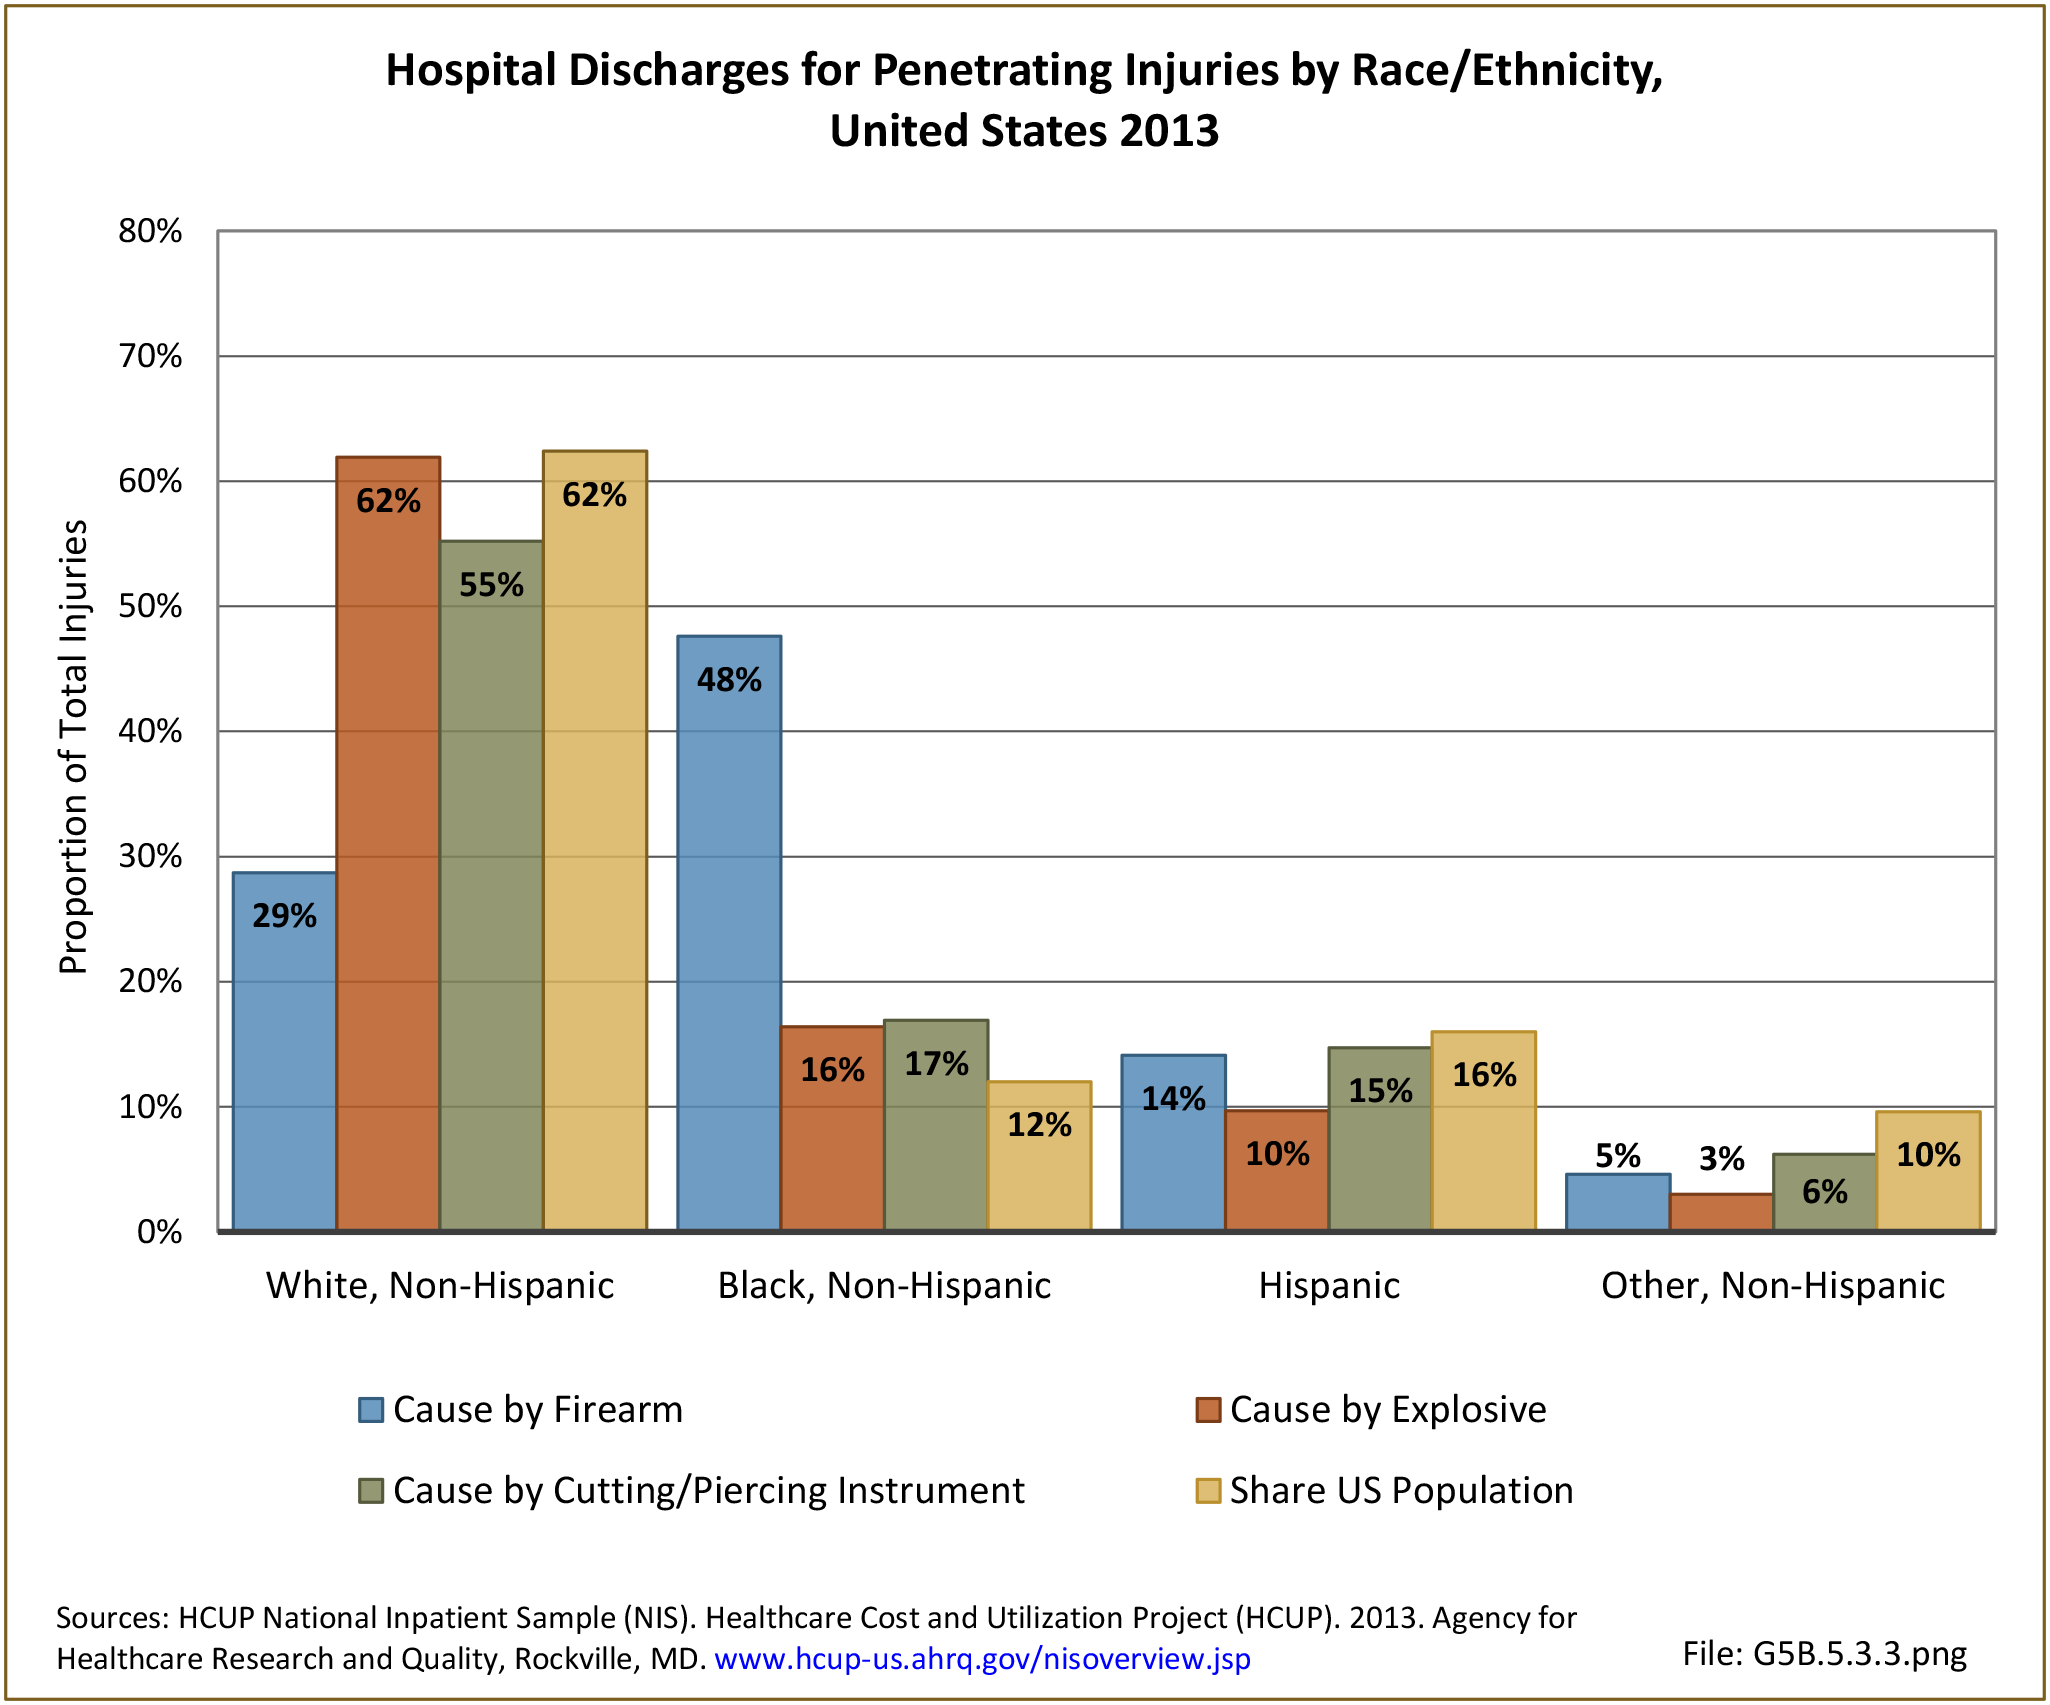
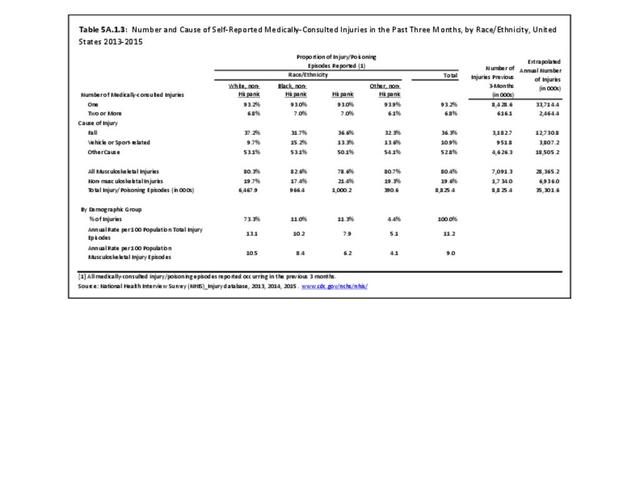
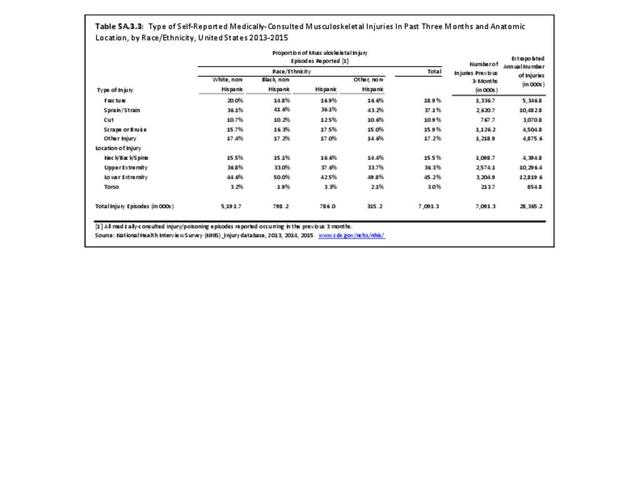
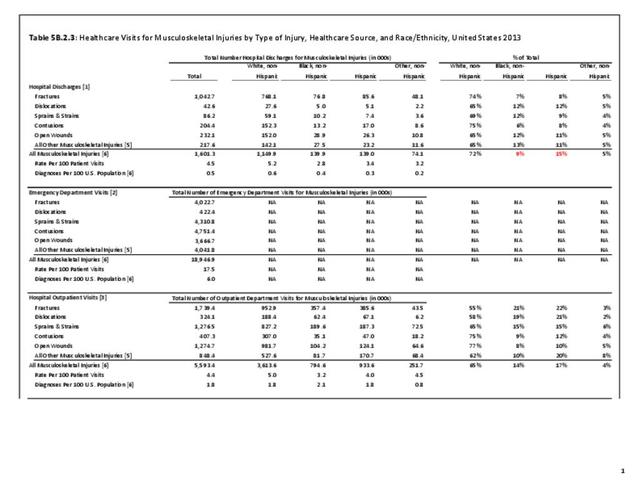
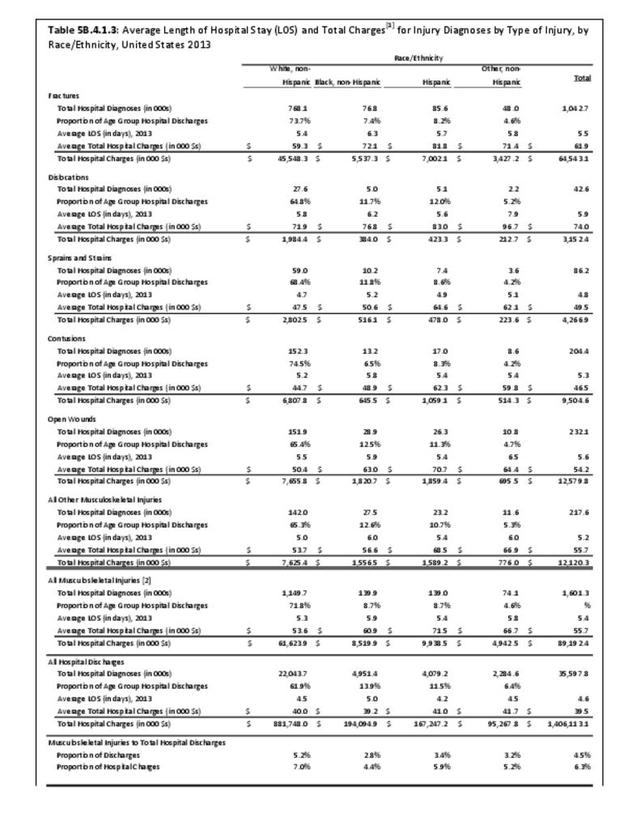
Using race/ethnicity as the comparison variable, there is less variation between groups with only vehicle or sport-related injuries varying. Black non-Hispanics report vehicle or sport-related injuries as a cause 15.2% of the time while non-Hispanic whites report only 9.7% of injuries caused by vehicle or sport-related causes. (Reference Table 5A.1.3 PDF CSV)

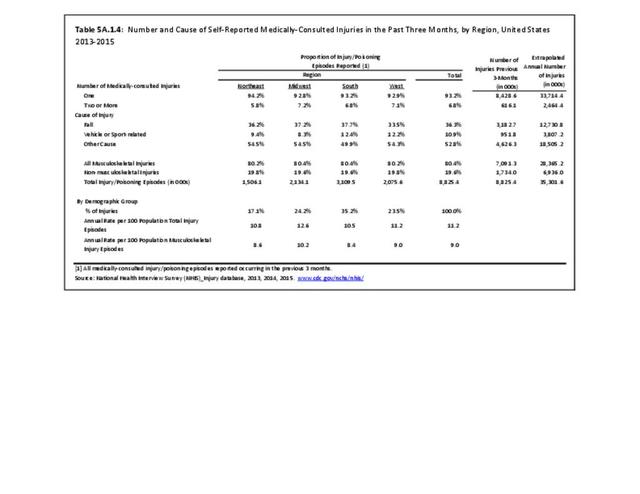
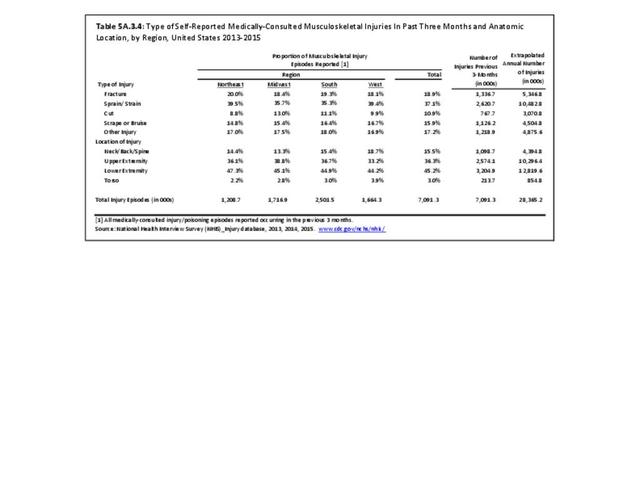
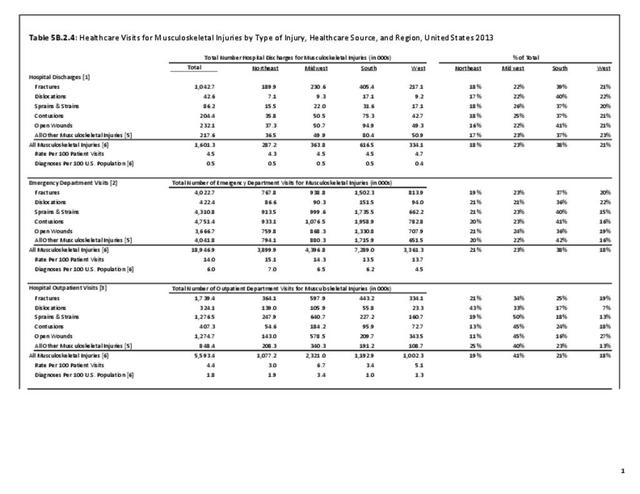
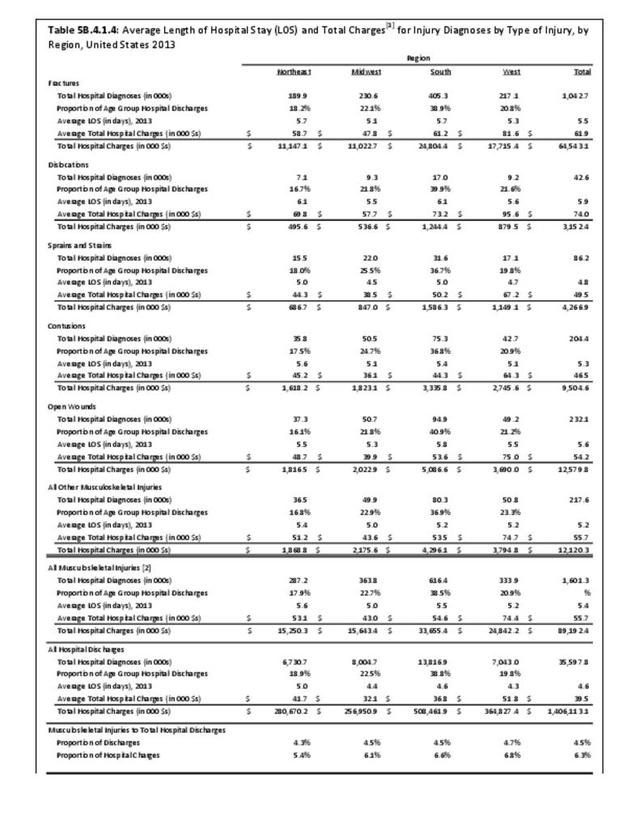
Geographic regional areas report only minor differences by cause of injuries, with vehicle and sport-related accidents slightly higher in the South and West regions than in the Northwest and Midwest regions. (Reference Table 5A.1.4 PDF CSV)

Edition:
- Fourth Edition