In 2012, nearly 29% of the US population age 18 years and older self-reported having had low back pain during the past three months. Among persons reporting low back pain, one in three (36%) suffered from back pain radiating into the leg. This is a greater percentage of pain than is reported for the upper limbs (shoulder, arm, elbow, wrist, and hands) and the lower limbs (hip, knees, ankles, and feet). Approximately one-third of persons reporting low back pain also experience neck pain. Among person reporting neck pain, the proportion experiencing back pain is as high as 71%. Both lower back and neck pain are reported in higher rates by females (30.5%; 17.6%) than males (26.6%; 12.6%). The highest rates for back and neck pain reported for both genders occur in the 45- to 64-year age group; there is a slight decrease in back and neck pain complaints in subsequent years (65 years and older), unlike that which occurs with pain reported in other joints. (Reference Table 2.1 PDF [1] CSV [2])

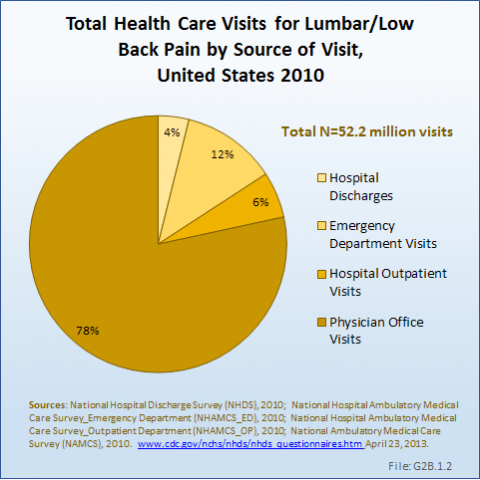
As discussed previously, the health care utilization by people with low back pain is only in part understood because of lack of information about visits to chiropractors, physical therapists, and others involved in the care of back pain. Even so, the reported numbers in the databases are very high. Data from the NCHS reports more than 52 million visits to hospitals, emergency departments, outpatient clinics, and physician offices with a diagnosis of low back pain. Four of five visits were to physician offices, but more than 2 million patients were hospitalized. (Reference Table 2.2.1 PDF [3] CSV [4], and Table 2.4.1 PDF [5] CSV [6])
The prevalence of low back pain health care visits is greatest in the 45- to 64-year age group, which comprises 26% of the US population; it is followed by the 18- to 44-year age group, comprising 37% of the population. Together, the 18- to 64-year group represents 63% of the population, but is responsible for 72% of all low back pain health care visits. However, when adjusting for the 2010 US census population estimates, the frequency of health care visits for low back pain per 100 US populations is highest in the 65- to 74-year age group, where it is 33.4%. In reviewing the three diagnostic categories, back disorders dominate in all age groups. Disc disorders are uncommon in the below-18-years age group, but increase in frequency as the population ages. Back injuries are more common under the age of 44 years (22%), and declines to only 7% to 9% in those 65 years and older. (Reference Table 2.2.2 PDF [7] CSV [8] and Table 2.4.2 PDF [9] CSV [10]) 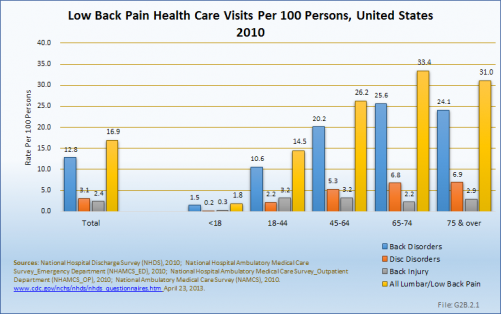
The average age of persons hospitalized in 2010 for low back pain was 61.1 years. This compares to an average age of 42.7 years for persons visiting an emergency department, 50.9 years for visits to outpatient departments, and 52.6 years for visits to a physician. These numbers are essentially unchanged since 2004. (Reference Table 2.2.2 PDF [7] CSV [8])
Low back pain is found more frequently among females than males, with females representing 55% of health care resource visits. Back disorders, in particular, are more frequent in females, while disc disorders are slightly more common in males. Nearly 8 in 10 (78%) female health care visits in 2010 for low back pain were classified as back disorders, compared to 73% for males. This is probably a reflection of the prevalence of spinal stenosis and degenerative spondylolisthesis in both sexes. (Reference Table 2.2.1 PDF [3] CSV [4])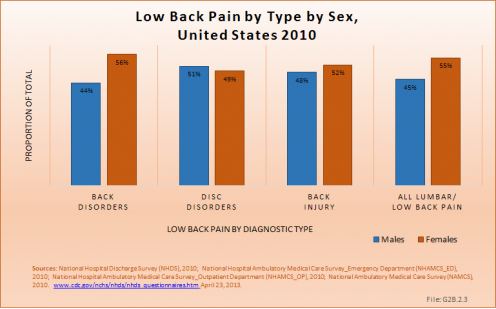
Persons hospitalized for lumbar/low back pain in 2010 spent on average nearly 5 days in the hospital. Persons hospitalized for lumbar/low back injuries were hospitalized for the longest period of time, on average 7.6 days. When comparing the total days of hospitalization for all causes to those for lumbar/low back pain, back pain constitutes 5% to 7% of the discharges and of total hospital days, indicating hospital stays are, on average, similar to those for other causes. The length of hospital stays has remained relatively stable since 2004. (Reference Table 2.9.1 PDF [11] CSV [12])
Although females are likely to have slightly shorter hospital stays for all causes of back pain, it is only for lumbar back injuries that there is a real difference between the sexes in length of stay.
Age is an important factor influencing length of stay. Although they constitute a small proportion of back pain hospitalizations, young persons under the age of 18 years have longer stays for back pain, in particular when compared to the average length of stay for persons in this age group; here the average length of stay is 1.5 to 2 times as long as for other diagnoses. After the age of 18 years, hospital stays for back pain tend to increase as the population ages. (Reference Table 2.9.2 PDF [13] CSV [14])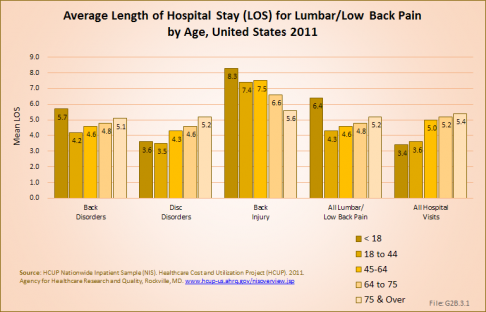
Average hospital charges are provided along with length of stay in the HCUP NIS database. On average, hospital charges for a lumbar/low back pain inpatient visit were 131% that of the average inpatient visit for any cause. In 2011, an estimated $117 million in charges were assessed against the 2.53 million inpatient stays for lumbar/low back pain, 9% of the estimated total $1.37 billion in hospital charges for that year. Mean charges of $70,300 were highest for lumbar injuries and, at $41,800, lowest for lumbar back disorders. (Reference Table 2.9.2 PDF [13] CSV [14])
Links:
[1] https://www.boneandjointburden.org/docs/T2.1.pdf
[2] https://www.boneandjointburden.org/docs/T2.1.csv
[3] https://www.boneandjointburden.org/docs/T2.2.1.pdf
[4] https://www.boneandjointburden.org/docs/T2.2.1.csv
[5] https://www.boneandjointburden.org/docs/T2.4.1.pdf
[6] https://www.boneandjointburden.org/docs/T2.4.1.csv
[7] https://www.boneandjointburden.org/docs/T2.2.2.pdf
[8] https://www.boneandjointburden.org/docs/T2.2.2.csv
[9] https://www.boneandjointburden.org/docs/T2.4.2.pdf
[10] https://www.boneandjointburden.org/docs/T2.4.2.csv
[11] https://www.boneandjointburden.org/docs/T2.9.1.pdf
[12] https://www.boneandjointburden.org/docs/T2.9.1.csv
[13] https://www.boneandjointburden.org/docs/T2.9.2.pdf
[14] https://www.boneandjointburden.org/docs/T2.9.2.csv